Repository navigation
[Bug]: PR detail/activity is re-fetched for every displayed PR on each focus, visibility change and 5-minute tick (merged PRs included), exhausting the GitHub GraphQL quota #13496
Description
Activity
Triage
Verdict: Bug, still present on
main(d5d48742c9). Focus, visibility, and the five-minute tick re-read pull request detail from GitHub, and activity reads for every pull request still on screen or viewed in the last five minutes go out on the same refresh signal. Merged and closed pull requests are included. The fifteen-second server cache does not cover that cadence, so two clients each pay. This is not #3581 or #5673.What the report gets right
useLiveRefreshis the hook behind the minified3e5/1e4constants. The interval is five minutes, the minimum gap is ten seconds, and it stops after six minutes without a click, key, or scroll. It runs onwindowfocus, onvisibilitychange, and on that interval while the window is visible (apps/web/src/hooks/useLiveRefresh.ts).The open pull request panel calls it and forces
pullRequests.detail:useLiveRefresh( () => { detailQuery.refresh(); }, { key: `pull-request:${environmentId}:${pullRequestKey}` }, );
refresh()ignores the client’s sixty-second stale time. The server then keeps detail and activity for fifteen seconds (DETAIL_CACHE_TTLinPullRequestService.ts). A focus return after that is a cache miss. The pull requests page uses the same hook to re-read the list.Activity is
gh pr view --json author,comments,reviews,commits(PULL_REQUEST_ACTIVITY_JSON_FIELDS). That is the paginated read in the trace. The focus hook does not call activity itself. The panel refetches activity when that pull request’supdatedAtchanges, and both detail and activity atoms subscribe topullRequests.subscribeRefreshes. A turn checkpoint (CheckpointReactor→refreshAfterTurn), a mutation, or an explicit invalidate bumps the project epoch, drops the cache key, and tells every still-alive detail and activity atom to read again.Those atoms stay alive for five minutes after the view unmounts (
Atom.setIdleTTLon the query and on the writable wrapper inpackages/client-runtime/src/state/pullRequests.ts). Open right-panel tabs subscribe for longer: each pull request tab without a linked snapshot mountspullRequests.detailfor its icon (RightPanelTabs.tsx). Unlinking a thread does not drop those atoms or tabs.t3.pullRequests.detail:*in localStorage is the snapshot written after a successful detail read so the panel can paint before the next RPC. It is not what schedules the fetch. A pull request that was opened, then unlinked, still matches that key and can still be in the burst.Merged pull requests are not special on this path. The background link sync already skips a pull request once every linked copy is merged (
PullRequestSyncReactor.ts,isDue), and a summary already held as merged is served without another host read. Detail and activity do not do that. Unlinking seventy merged pull requests would not shrink these bursts.Two clients of one server do not share the refresh. In-flight identical reads coalesce, and the fifteen-second cache is what the “two people opening the same page” comment is about. Focus timers and five-minute ticks are much further apart than that, so each client’s burst misses and runs
ghagain.The pause error is real.
GitHubCli.executeforpr viewchecksGitHubGraphQlBudgetbefore the process starts, and the messagegithub requests to github.com are paused until the rate limit resetsisSourceControlRateLimitPausedError. The preflight that feeds that budget isgh api rate_limitwith GraphQLcosthardcoded to1, and it replaces a cost learned from a real query whenever remaining has fallen.gh pr viewnever reports its own cost. A burst that starts above the ten-percent floor can spend about three points per call, more whenghpaginates, while the budget subtracts one. That matches the quota going from 4,974 to 2,206 in a few minutes and later hitting zero, with the pause landing after the budget is already gone.Why #3581 and #5673 are a different path
#3581 is background
gh pr listper branch. #5673 stopped that amplification. Both are closed. Link sync now batches summaries and does not walk merged links every minute. The trace parent spans here arews.rpc.pullRequests.detailandws.rpc.pullRequests.activity.Still on main
origin/mainisd5d48742c9. The two commits after this checkout are Codex protocol only. Package version on main is0.0.42. The reported build is0.0.42-workspace-guard.1. Nothing newer in the nightlies changes this refresh policy. There is no open duplicate that describes this detail/activity focus loop.What a fix has to change
Keep a shared server cache that actually covers the focus and five-minute cadence, and do not bump every pull request on a project into a host read just because one turn checkpointed. Stop re-reading detail and activity once the pull request is merged or closed. Count the real GraphQL cost of
gh pr viewso the ten-percent reserve trips before the quota hits zero. The localStorage snapshot can stay. It is only paint.Workaround
The
ghwrapper already in use matches the missing policy: cachepr view --jsonandpullRequest(number:)reads for about ten minutes, and for much longer once the pull request is merged or closed. Closing pull request tabs, and leaving the pull requests page, drops the mounted readers. Unlinking threads does not.Disposition
Leave #13496 open. Add
bug. Do not close it as a duplicate of #3581 or #5673.Another data point, from the macOS desktop app (T3 Code Alpha) on a single machine. I took these numbers from
~/.t3/userdata/logs/server.trace.ndjson*for 2026-09-29, 15:47–18:39. EachGitHubCli.executespan is attributed to itsws.rpc.*or reactor ancestor.Root ghcallsws.rpc.pullRequests.detail577 ws.rpc.pullRequests.activity308 ThreadPullRequestReactor.synchronize290 ThreadSettlementReactor.sweep145 ws.rpc.vcs.refreshStatus18 everything else 28 total 1,366 The calls come in bursts every ~3 minutes: 128 at 17:28, 128 at 17:31, 125 at 17:37, 128 at 17:41, 127 at 17:44 and 254 at 18:36. That is the same pattern as the original report.
The bursts also have a second effect. While one is running, each
ghcall takes much longer (p50 6.3 s, p90 22.8 s, max 29.3 s), so a focus-triggeredvcs.refreshStatusgets stuck behind it and raises the "Some requests are slow" toast:Start vcs.refreshStatusdurationghcalls running at the same time17:32:26 16.3 s 66 18:37:15 19.0 s 94 18:37:50 27.5 s 124 In the 27.5 s one, 25.0 s was spent in
lookupStatusPr → findLatestPrForHeadContext → GitHubCli.execute. So the slow-request toasts people report forvcs.refreshStatusseem to come mostly from these PR detail/activity bursts. #13841 (fewer and cached detail reads) and #13052 (don't blockrefreshStatuson the remote lookup) would each fix one half.Another data point from the macOS desktop app (T3 Code Alpha 0.0.44), single machine, one GitHub account.
I sampled
{rateLimit{used}}once a minute from 23:23 to 00:25 and tookpssnapshots of everyghprocess together with its parent.- Baseline: about 10 GraphQL points per minute.
- Bursts: at 23:30 (+438), 23:32 (+433), 23:39–23:43 (+405, +212, +229, +361, +116), 23:57 (+429), and 00:23–00:24 (+259, +193).
- Total: 3,248 of the 5,000 points were used in the 23:15–00:15 window, almost all of them in these bursts. Earlier that day the quota ran out, and other tools on the same account started to fail with
API rate limit already exceeded.
In every burst, the sampled
ghprocesses were children of the T3 Code server process. Two kinds of calls showed up:gh pr view <n> --json …,statusCheckRollup,body,changedFiles,…(the detail fields)gh api graphql -F number=<n>
Apart from the T3 Code server, only one other process ran
ghduring the bursts, and it only made REST calls.Which PRs were read in the bursts:
- Mostly merged PRs, many of them linked to threads that were settled long ago (for example
ko-x-mainComment on diff to give agent context #1003, fix: improve project favicon detection for monorepos #1024, fix(ws,sidebar): structured error payload and prevent horizontal overflow on project import #1045, [Feature]: Amp Code (or CLI agent) support #1055). - Some merged PRs that are not linked to any thread at all (Add native context menu to delete threads #12, Sync diff renderer and worker theme with resolved app theme #108, feat: interactive install wizard + CI/release fixes #591, fix:diff panel doesnt collapse #992). These fit your finding that PRs viewed at some point stay in the refresh set.
Both auto-settle options are off in this install. 182 of 196 threads are settled, 2 are archived, and there are 99 PR links, almost all of them to merged PRs. Settling a thread does not seem to take its PR out of the refresh.
In the bundle I can see
refreshAfterTurnclearing the whole PR read cache after every completed turn, in any thread. With several agents running in parallel, that alone makes the bursts frequent. #13841 looks like it addresses exactly this. Holding merged or closed PRs for 10 minutes would have removed most of what I measured.A side note for anyone measuring this:
gh api rate_limitreported the GraphQL bucket wrong for me (it showed 112 used while a real GraphQL query returned 5000/5000).gh api graphql -f query='{rateLimit{used remaining resetAt}}'is the number to trust.Another data point, from T3 Code Alpha 0.0.42 on macOS (single machine, one GitHub account, about ten agent threads active at the same time). It shows a refresh path that the triage above does not cover: every turn that completes in any thread refreshes every open PR view.
Turn completion invalidates the whole PR read cache
In the orchestration reactor, each
turn.completedorturn.abortedevent callspullRequests.refreshAfterTurn:const refreshAfterTurn = suspend(() => { turnRefreshEpoch = listingsEpoch = ++epochCounter; return readCache.invalidate.pipe( andThen(set(pullRequestRefreshes, turnRefreshEpoch)), ); });
readCache.invalidateclears the cache for all PRs, not only the PR of the thread whose turn completed.subscribeRefreshesthen sends the new epoch to every client. In the web client,pull-requests:detailandpull-requests:activityuse that stream as theirrefreshTrigger, so each mounted detail and activity query reads GitHub again. The 15-secondDETAIL_CACHE_TTLcannot help, because the cache was just cleared.With one interactive thread, this is not a problem. With many agent threads, turns complete every few seconds, so the open PR views read GitHub on that schedule.
Measured
From
~/.t3/userdata/logs/server.trace.ndjson*, 22:46–23:18 UTC,GitHubCli.executespans grouped by ancestor:Root ghcallsws.rpc.pullRequests.detail1,338 (546 successful detail RPCs) PullRequestSyncReactor.syncGroup409 ws.rpc.pullRequests.activity180 branch lookups ( findLatestPrForHeadContext)~50 The GraphQL budget was empty at about 23:12. After that, the detail RPCs continued and failed with
paused until the rate limit resets,GitHub API rate limit exceeded, andPull request not found. Otherghusers on the same account (agent sessions) could not create a PR. In apssample of everyghprocess during this time, the agent sessions made only REST calls.The activity read costs 15 points
getChangeRequestActivityrunslistReviewThreadComments(REVIEW_THREADS_GRAPHQL_QUERY) next togh pr view --json author,comments,reviews,commits. A dry run of that document gives:rateLimit(dryRun: true) { cost } → {"cost": 15}Most of the cost comes from
reactors(first: 10)insideREACTION_GROUPS_FIELDS, undercomments(first: 10)underreviewThreads(first: 100). That is 1,000 possible reactor connections. Reading reactors only when the user opens a reaction popover, or readingreactionGroups { content viewerHasReacted reactors { totalCount } }without nodes, would make each activity read much less expensive.Suggested changes
- On turn completion, invalidate and refresh only the PR(s) linked to that thread's branch, not the whole read cache.
- Coalesce turn-triggered refreshes, for example to at most one per PR per minute.
- Do not re-read merged or closed PRs on a turn refresh.
- Remove
reactors(first: 10) { nodes … }from the review thread query, or read it lazily.
The
/rate_limitmismatch in #14673 is also present here. On the same token in the same minute,gh api rate_limitshowed GraphQLused 22, and a GraphQL{rateLimit{used remaining}}read showedused 5000, remaining 0.Written with Claude Code.
Codex Replying on behalf of Max
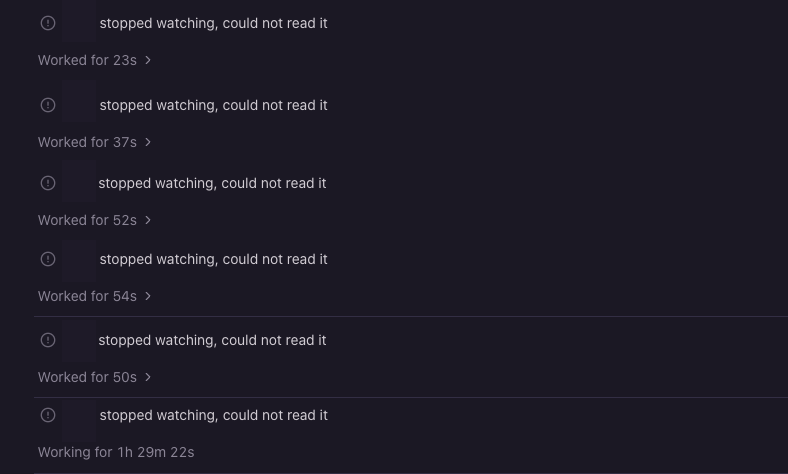
Another observed consequence: PR watches repeatedly stop with “stopped watching, could not read it”. For several still-open PRs in a private repository, the agent reports restoring the watch, but the same notification returns. The agent's updates also report GitHub GraphQL
RATE_LIMITerrors.The screenshot above is cropped from the actual T3 conversation to show the repeated notifications. Private PR numbers and conversation details are omitted. These PRs are in a private repository; no PR links are included.
The
watch_pull_requesttool documents that T3 polls every minute and stops watching after it cannot read a PR for 15 minutes. The observed sequence suggests that rate limiting prevents reads, the watch stops and wakes the agent, the agent restores it, and it stops again while reads remain unavailable. This causes repeated agent runs and gaps in PR monitoring.Rate limiting is the suspected cause, not a log-confirmed cause for each watch failure. The exact T3 build was not captured, and no new trace or reproduction was collected for this comment.
Expected behavior: preserve the watch during a temporary rate-limit pause, wait until the reset time, and resume automatically instead of repeatedly requiring an agent turn to restore it.
Model: gpt-6.1-sol. Agent tool: Codex harness in T3 Code.
Bitbucket behavior is similar. It seems to be slamming Bitbucket. Including wasting about 17% of the calls on a non-existent API endpoint:
Bitbucket polling
- Volume: 2,795 calls in about 100 minutes, so roughly 28 a minute or ~1,700 an hour. That's more than Bitbucket's documented baseline of 1,000 an hour per user, but there were no 429s (rate-limit errors).
- Per PR: each open PR is polled on its own timer:
PR Interval repo1#282 ~26s repo2#254 ~25s repo3#128 / #129 ~50s repo1#283 ~4 min - Each poll makes about 5 calls: the PR itself,
statuses,diffstat,conflictsanduser/permissions/repositories. It fetchescommitsandcommentsless often. - Wasted calls:
/2.0/user/permissions/repositoriesreturned 404 on all 466 calls. Bitbucket answers it with its genericNotFoundHandler, which suggests the endpoint has been removed. That's a T3 bug worth reporting, and it accounts for about 1 in 6 of the calls.



Before submitting
Area
apps/web pull request views + apps/server PullRequestService / GitHub CLI integration
Steps to reproduce
gh api graphql -f query='{rateLimit{remaining resetAt}}'.GitHubCli.executespans in~/.t3/userdata/logs/server.trace.ndjson*, grouped by theirws.rpc.*ancestor.Expected behavior
PR detail and activity reads are cached and shared across clients. A merged or closed PR is not re-fetched on every focus change. Refreshing should back off before the user's GitHub quota runs out, not only after (
github requests to github.com are paused until the rate limit resets).Actual behavior
Each client re-requests
pullRequests.detailandpullRequests.activityfor every PR it shows. This happens on window focus (after 10 s), onvisibilitychange, and every 5 minutes while the user is active (the refresh hook withya=3e5/1e4inPanelLayoutControls). Merged PRs are included.Measured on one machine (trace data plus
rateLimitsampling):ghcalls every 3–4 minutes. In one 7-minute window, 822 of 881 T3ghcalls came fromws.rpc.pullRequests.detail(264 RPCs) andws.rpc.pullRequests.activity(192 RPCs).gh pr view --json author,comments,reviews,commitspaginates, so this averaged ~3 GraphQL points per call.t3.pullRequests.detail:*entries in the client's localStorage.This is a different path from #3581/#5673, which fixed per-branch
gh pr listpolling.Impact
Major degradation or frequent failure
Version or commit
t3code 0.0.42-workspace-guard.1 (desktop AppImage), gh 2.101.0
Environment
Linux 7.0 (Ubuntu), desktop app plus a second web client via
tailscale serveLogs or stack traces
Workaround in use: a
ghwrapper earlier on the server's PATH. For calls whose parent is the T3 server, it cachespr view --jsonand aliasedpullRequest(number:)GraphQL reads for 10 minutes, or 24 hours once a PR is merged or closed. With it, later bursts of ~125 calls cost ~9 points instead of ~350.