[Metrics UI] Manage jobs and View anomalies buttons not showing for Kubernetes Pods ML jobs #79576
Description
Kibana version:
7.10.0
Elasticsearch version:
7.10.0
build_hash : 1c136bb7fc6ae52a24f60fe6cfa3cbb7b41feb6e
build_date : 2020-10-04T14:15:14.622613Z
Browser version:
Google Chrome (Version 85.0.4183.102)
Describe the bug:
When anomaly detection jobs for Kubernetes Pods are enabled via the Metrics app, no buttons show up to manage the jobs enabled as well as view the anomalies.
Steps to reproduce:
- Deploy 7.10.0-SNAPSHOT
- Restore metrics snapshot
- Enable/Create ML jobs for Kubernetes Pods (Metrics -> Anomaly Detection -> Kubernetes Pods (Enable))
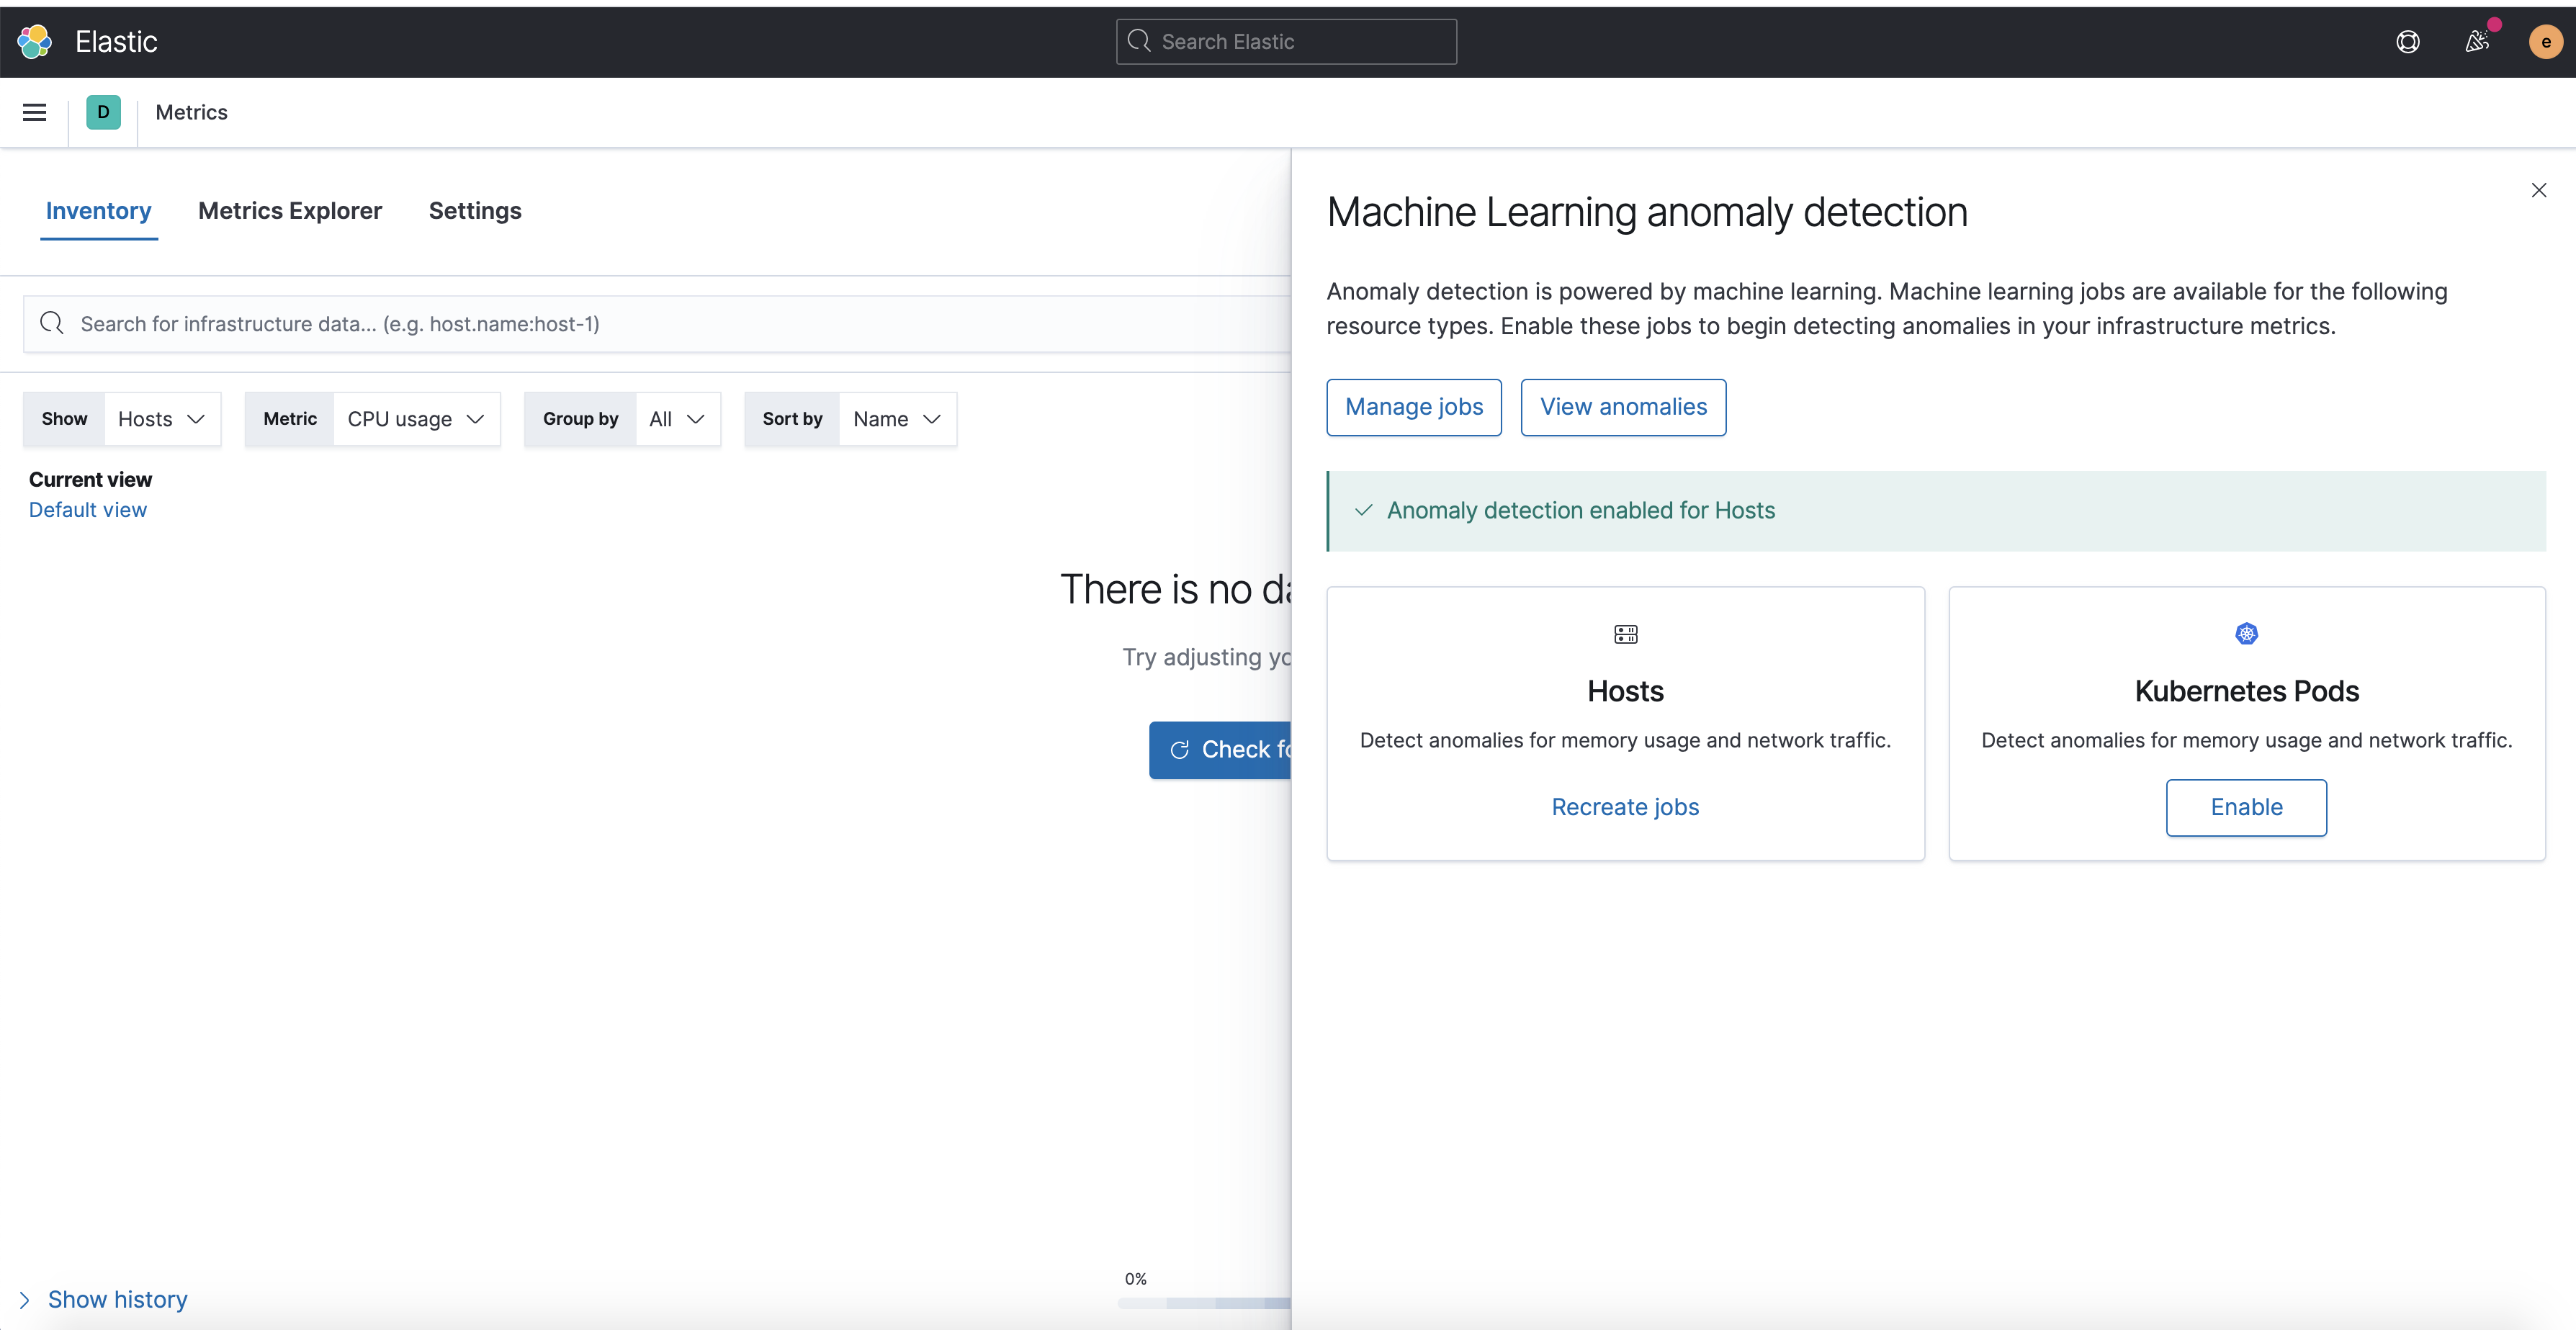
- Job gets created, but no 'Manage Jobs' and 'View anomalies' buttons show up. Note that this works when enabling/creating jobs for Hosts.
Expected behavior:
After ML job get created, 'Manage Jobs' and 'View anomalies' buttons show up.
Screenshots (if relevant):