TSVB table trend arrows always show slope of 0 #59656
Description
Kibana version: master
Elasticsearch version:
Server OS version:
Browser version:
Browser OS version:
Original install method (e.g. download page, yum, from source, etc.):
Describe the bug: The trend arrows in the TSVB table visualization should indicate the slope of a linear regression of the given metric over time, but they always show a 0.
Steps to reproduce:
- Create TSVB vis
- Go to table
- Select group by field
- Enable trend arrows for metric
Expected behavior:
Trend arrows should be shown for each line respective to slope, but slope is always zero.
Screenshots (if relevant):
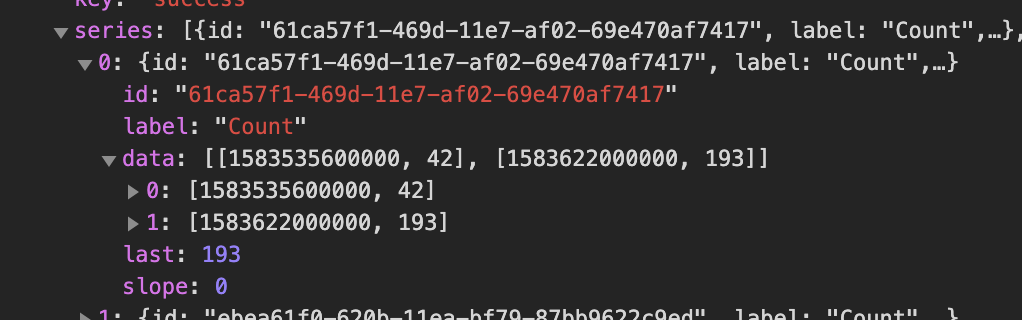
Response showing a timeseries consisting out of two values clearly having a positive linear regression, but the slope value is still zero. (Value is calculated in src/plugins/vis_type_timeseries/server/lib/vis_data/table/process_bucket.js)
Errors in browser console (if relevant):
Provide logs and/or server output (if relevant):
Any additional context:
This might very well be me misunderstanding how this feature is supposed to work, but if that's the case it's probably worth mentioning it in the docs.