Add view generation time to timeline tab when 'time' and 'view' collectors are enabled. #1178
Conversation
|
Can't we fill the timeline from the existing events? |
|
Ah yes they don't have timing information unfortunately. This seems interesting, not sure if it has any downsides though. |
|
Ye, unfortunatly there is only the |
|
@vdauchy trying to test this out, but not seeing any timeline entries for the views: Testing this out by requiring "repositories": [
{
"type": "vcs",
"url": "https://github.com/vdauchy/laravel-debugbar"
}
]Am I missing anything or should the rendering not appear in the timeline using this PR? Thanks. |


 bilfeldt
left a comment
bilfeldt
left a comment
There was a problem hiding this comment.
A minor glitch found for the checking of enabled/disabled state
|
Hi @bilfeldt ! Thank you so much for spending some time double checking my PR, this is really appreciated :-) I updated the code so now it uses the Thanks for your feed back ! |
No, thank you for the PR @vdauchy 😄 This is a great improvement to the package as it gives a perfect overview of the view rendering. This is a neat feature that is currently missing in other packages like Laravel Telescope and Clockwork.
I can confirm that the fix works as expected 👍 |
|
What do you mean, how do Telescope and Clockwork render the views then? I think I implemented views in Telescope myself, using the same events, but no timing. |
|
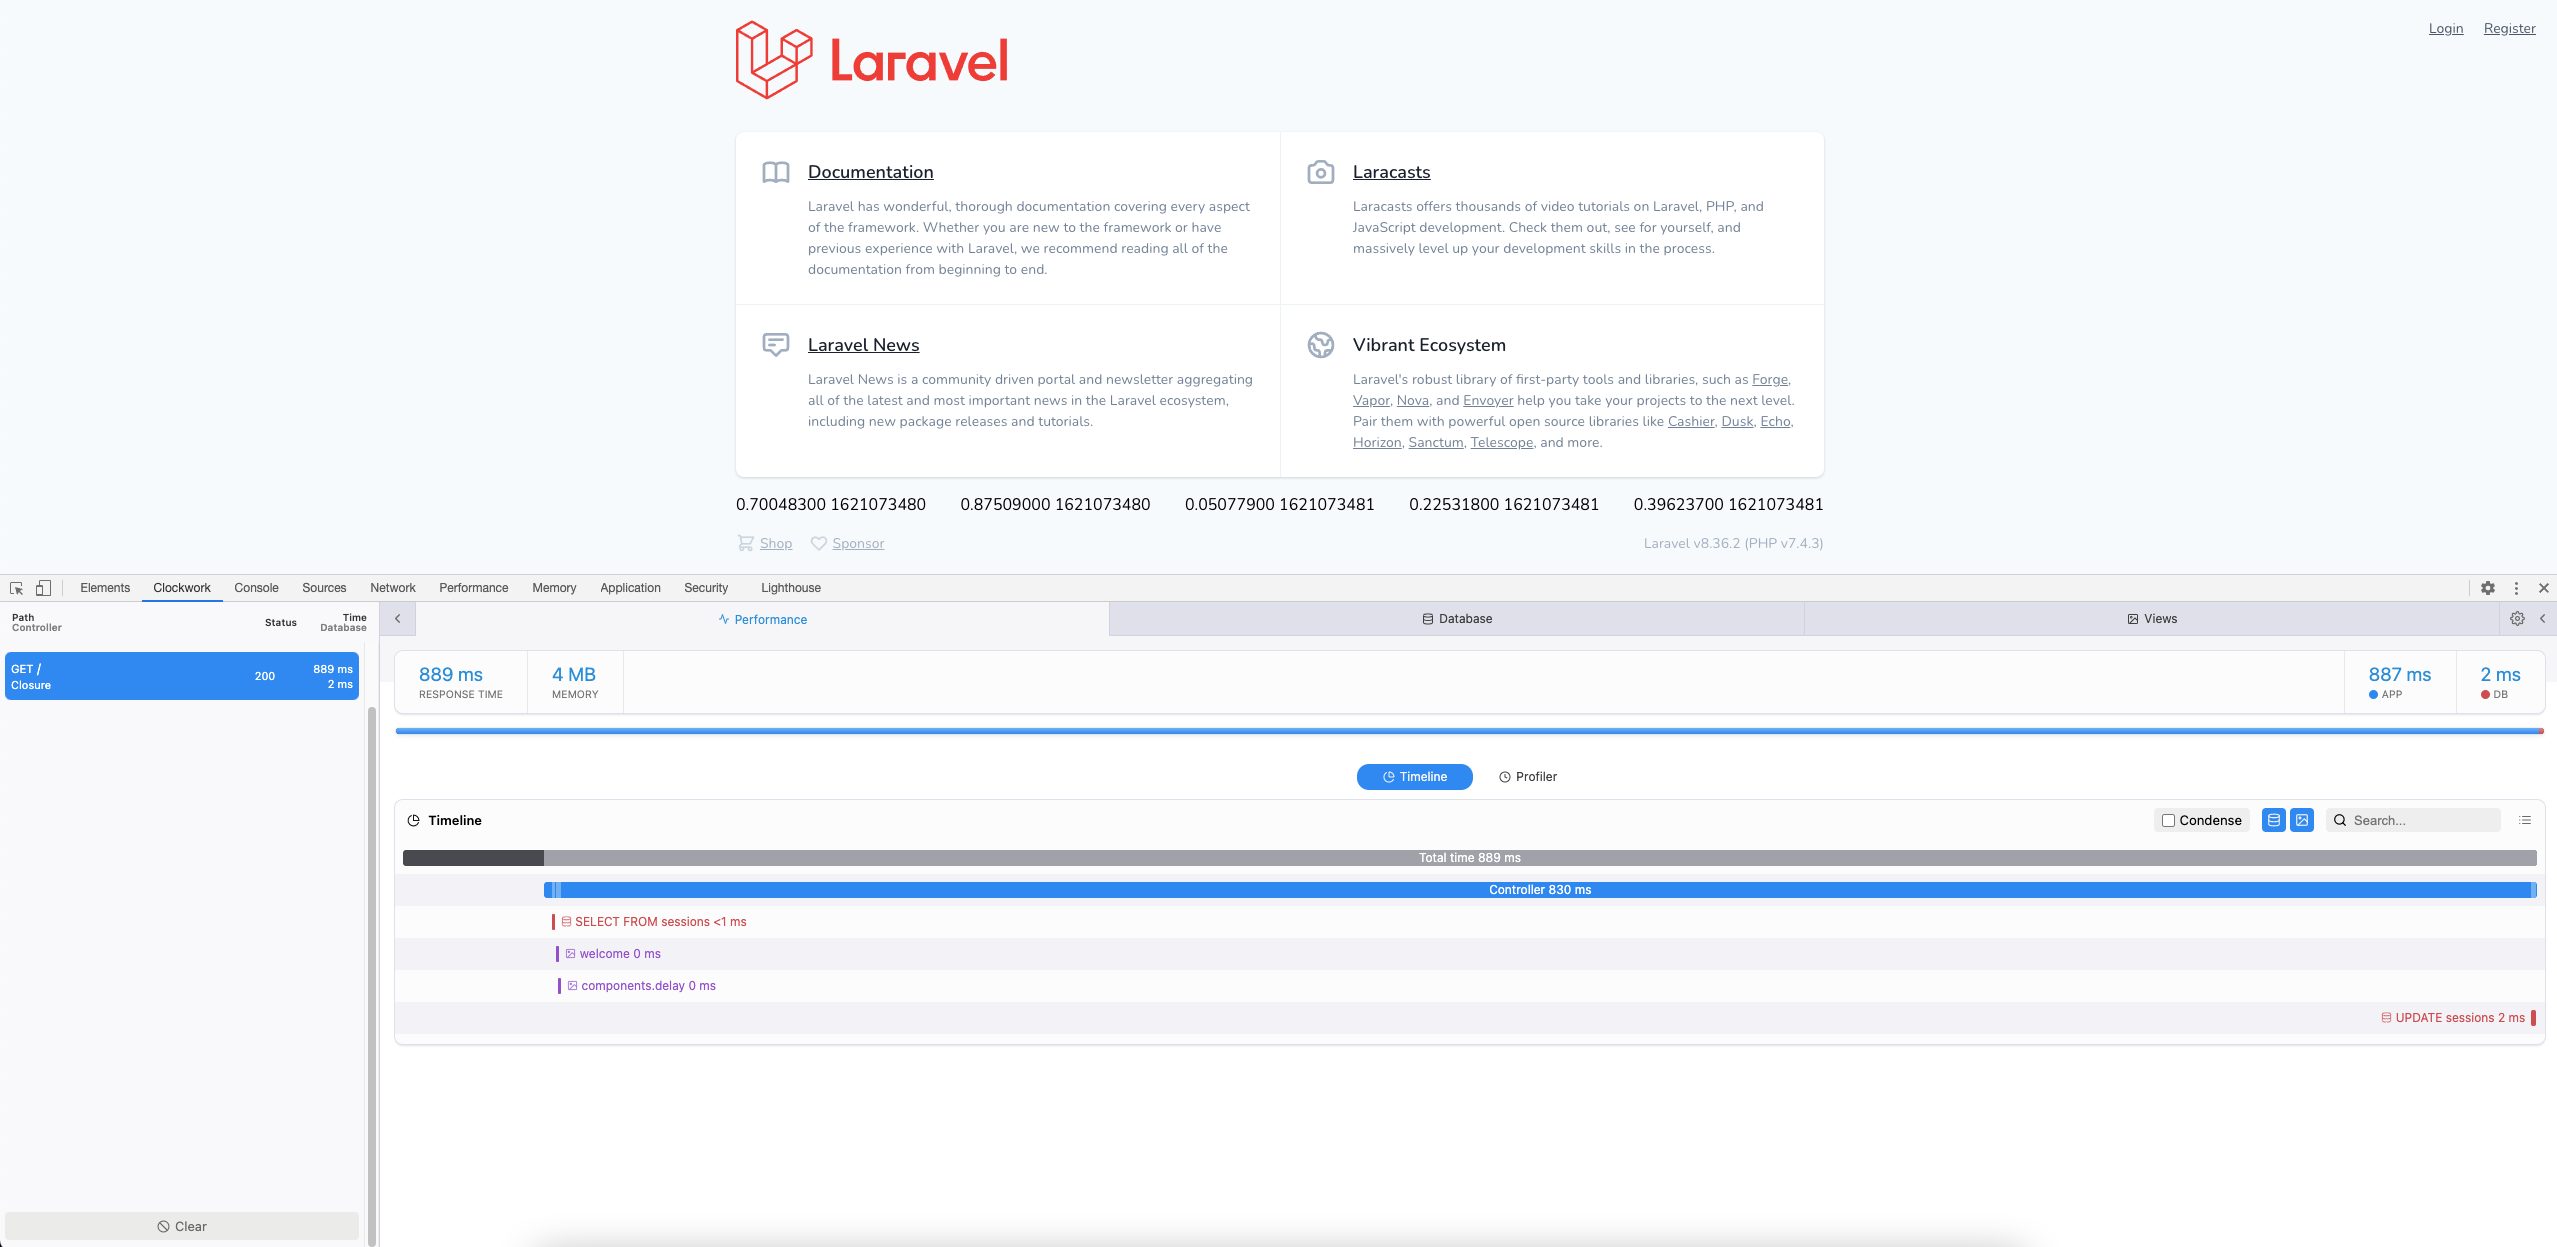
I think clockwork renders the timeline, but not with duration. We could do that just like we do with the query collector, if it's enabled; |
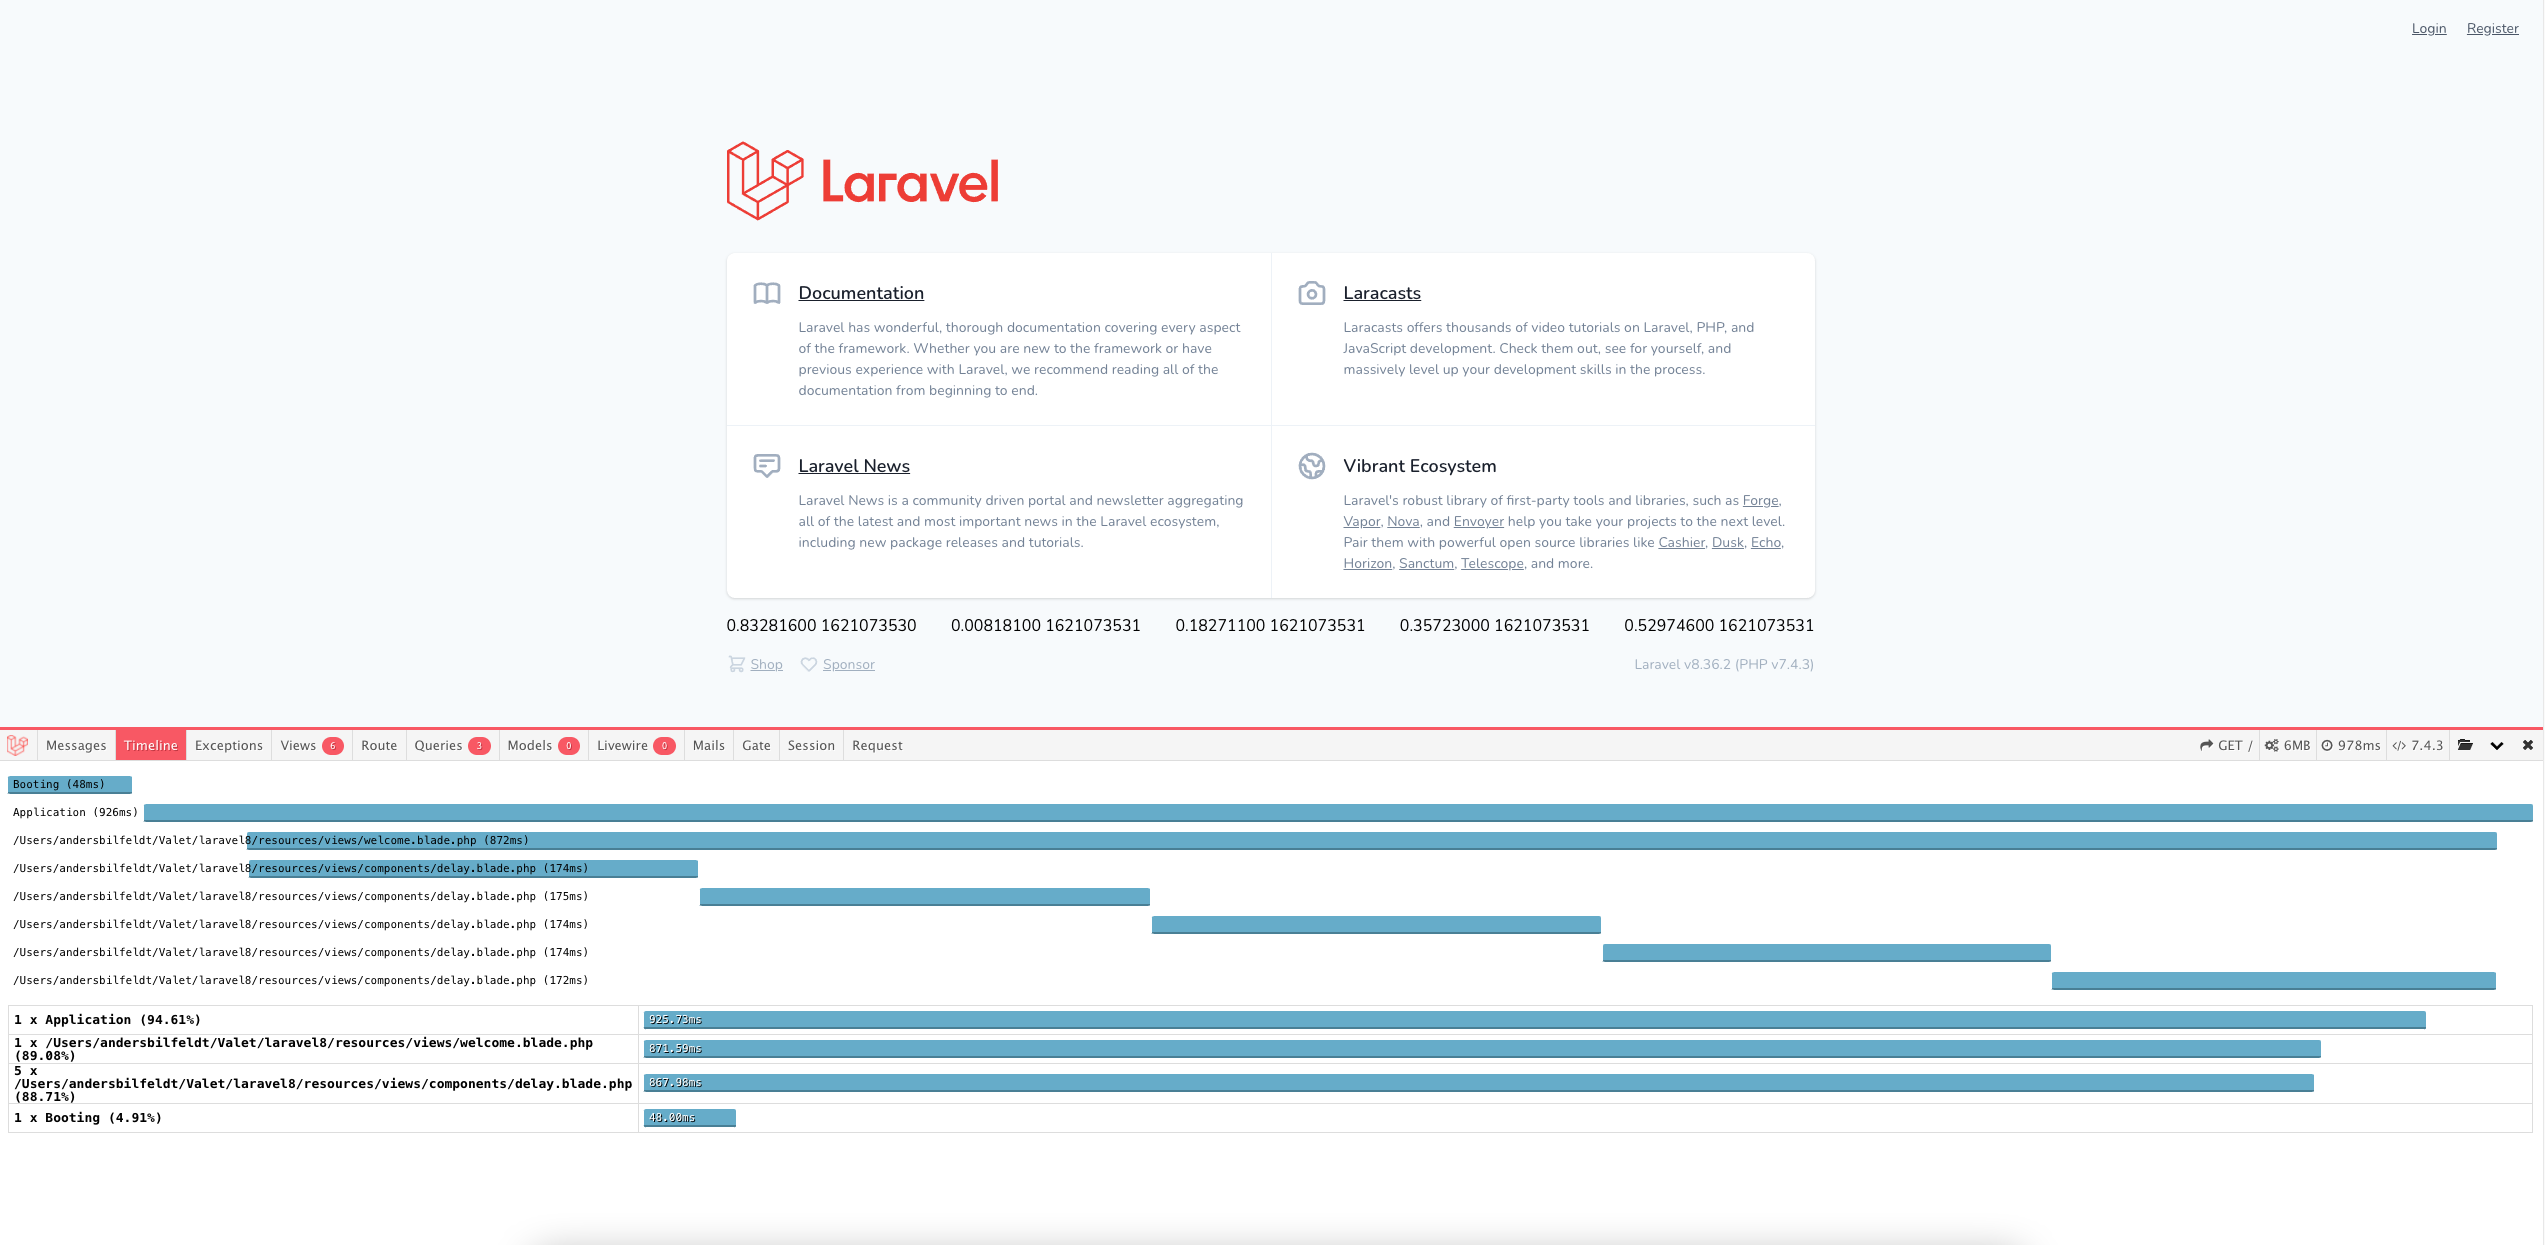
@barryvdh As you know (being the author of aravel/telescope/pull/698) then timing is not currently part of Laravel Telescope. Here is an example of a Laravel 8 welcome screen with the rending of 5 // resources/views/welcome.blade.php
...
<div class="flex justify-center mt-4 sm:items-center sm:justify-between">
@for ($i = 0; $i < 5; $i++)
<x-delay />
@endfor
</div>
...And the // resources/views/components/delay.blade.php
<div>
@php usleep(100000) @endphp
{{ microtime() }}
</div>Clockwork does show that the
Now with debugbar and this PR the result is just super 👍
You can see
Simply perfect for my usecases. |
|
@vdauchy this is so much helpful, thanks and a lot of respect to you for this. Guys, what are you waiting for, let others enjoy such an awesome feature! :) |
|
Okay I like this but I would like to put it behind a feature flag (for now). laravel-debugbar/config/debugbar.php Lines 163 to 165 in eb61c2f And add it to the existing checks? |
|
Changed that and merged. Also shortened the path; b8914ce |
|
I have not been able to get it to work, apparently some third party package instantiated |
Hi,
This pull request is a proposition to add the time spent generating views to the timeline tab.
I implemented this feature a while ago in this package: https://github.com/vdauchy/laravel-debugbar-view-meter so anybody can check it already.
I just thinks that this might be good to nativelly support it.
Thanks :-)