Boxplot breaks with yaxis option logarithmic:true #3284
Description
Description
When I try to create a boxplot with logarithmic scale, the boxplot will break. Depending on the data, the plot is not drawn at all or moved to the top, outside the plot and only the lower part is shown inside the plot. I already tried to use forceNiceScale:true to fix this.
I originally stumbled across this bug while using react-apexcharts, but quickly recreated it here.
Steps to Reproduce
- Create a boxplot
- Set data to
[1,2,3,14,57000] - Set yaxis option
logarithmic: true
Expected Behavior
The boxplot is shown and drawn with a logarithmic scale.
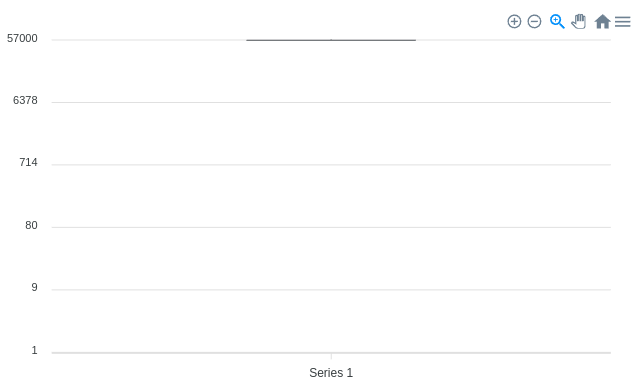
Actual Behavior
Depending on the given data it is not shown at all, or (see example) the min is drawn where the max should be. The bar will then extend far outside the plot to the top. This can be seen, by inspecting the chart with the dev tools.
Screenshots