Node startup fails on Azure App Service #145
Description
This is related to #143 . Basically when we had an outage last week we encountered the long connection timeout but we did not understand why the connection failed in the first place. After some investigation the error occured while changing the application insights configuration on the app service. It seems that changing the application insights configuration activated the following configuration setting without our knowledge:
XDT_MicrosoftApplicationInsights_NodeJS = 1
This influences Node JS processes started on the app service host causing them to create an additional output at the beginning:
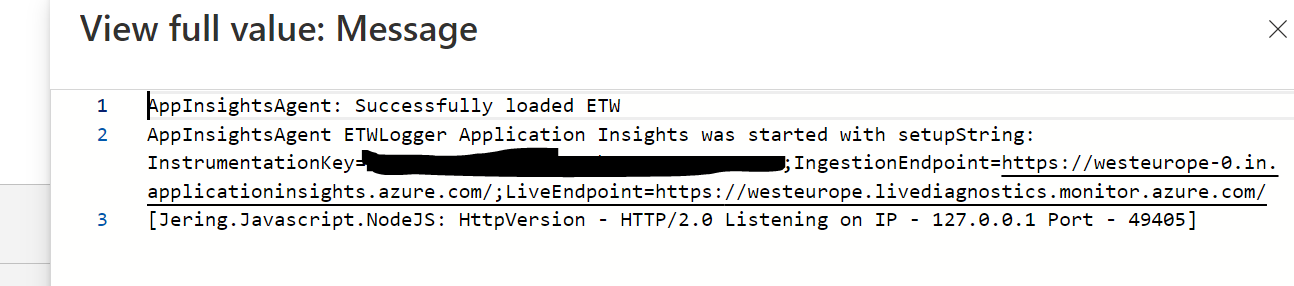
AppInsightsAgent: Successfully loaded ETW
AppInsightsAgent ETWLogger Application Insights was started with setupString: InstrumentationKey=XXX;IngestionEndpoint=https://westeurope-0.in.applicationinsights.azure.com/;LiveEndpoint=https://westeurope.livediagnostics.monitor.azure.com/
[Jering.Javascript.NodeJS: HttpVersion - HTTP/2.0 Listening on IP - 127.0.0.1 Port - 52511]
Notice the additional output at the beginning of the process which is not created by our Javascript code but is somehow injected. Now that should not be a problem because your library ignores all lines until the banner message and the DataReceived event is supposed to be line by line. When I activate all logging for your library I noticed however that when logging the process output both the app insights message and the banner message are contained in a single data event:
This means that the banner is never recognized by the library (which only checks StartsWith) and therefore is waiting until the timeout for the process even though it's perfectly healthy.