-
Notifications
You must be signed in to change notification settings - Fork 1
Visualisation Features
The main way of visualizing data in Evidente is by selecting them from the provided checkboxes under the menu Visualize Data.

Every single visualized element can be removed from the checkboxes under the menu Visualize Data. If the whole view should be reseted, the right-most button on the right-upper side of Evidente can be used to remove all visualized elements.

All types of data have a default color scale, that can be modified at will. This can be done from the legend of the visualisation.
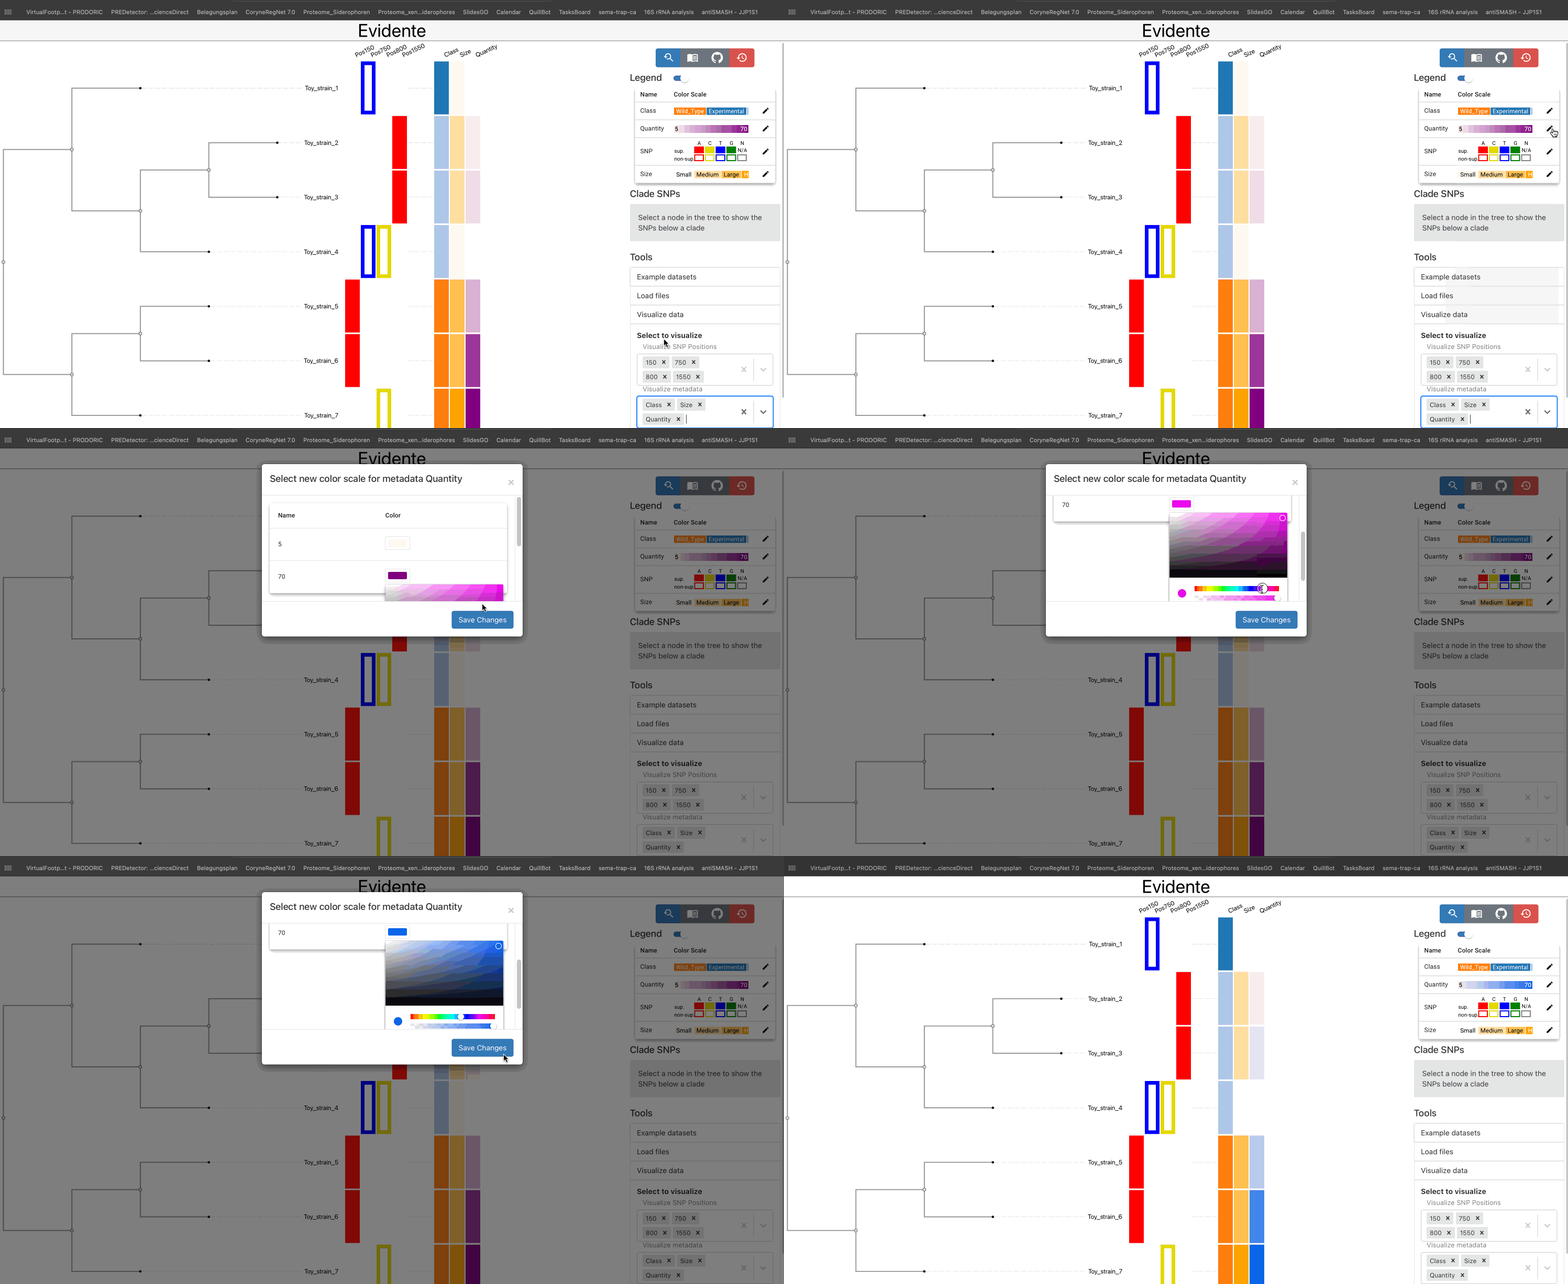
The legends for categorical and ordinal data are draggable, if the legend cannot show all categories in the available space. If a specific column contains more than 12 categories, the legend is not shown directly but a pop-up window. This provides the user a better interface to interact with each coloured element.
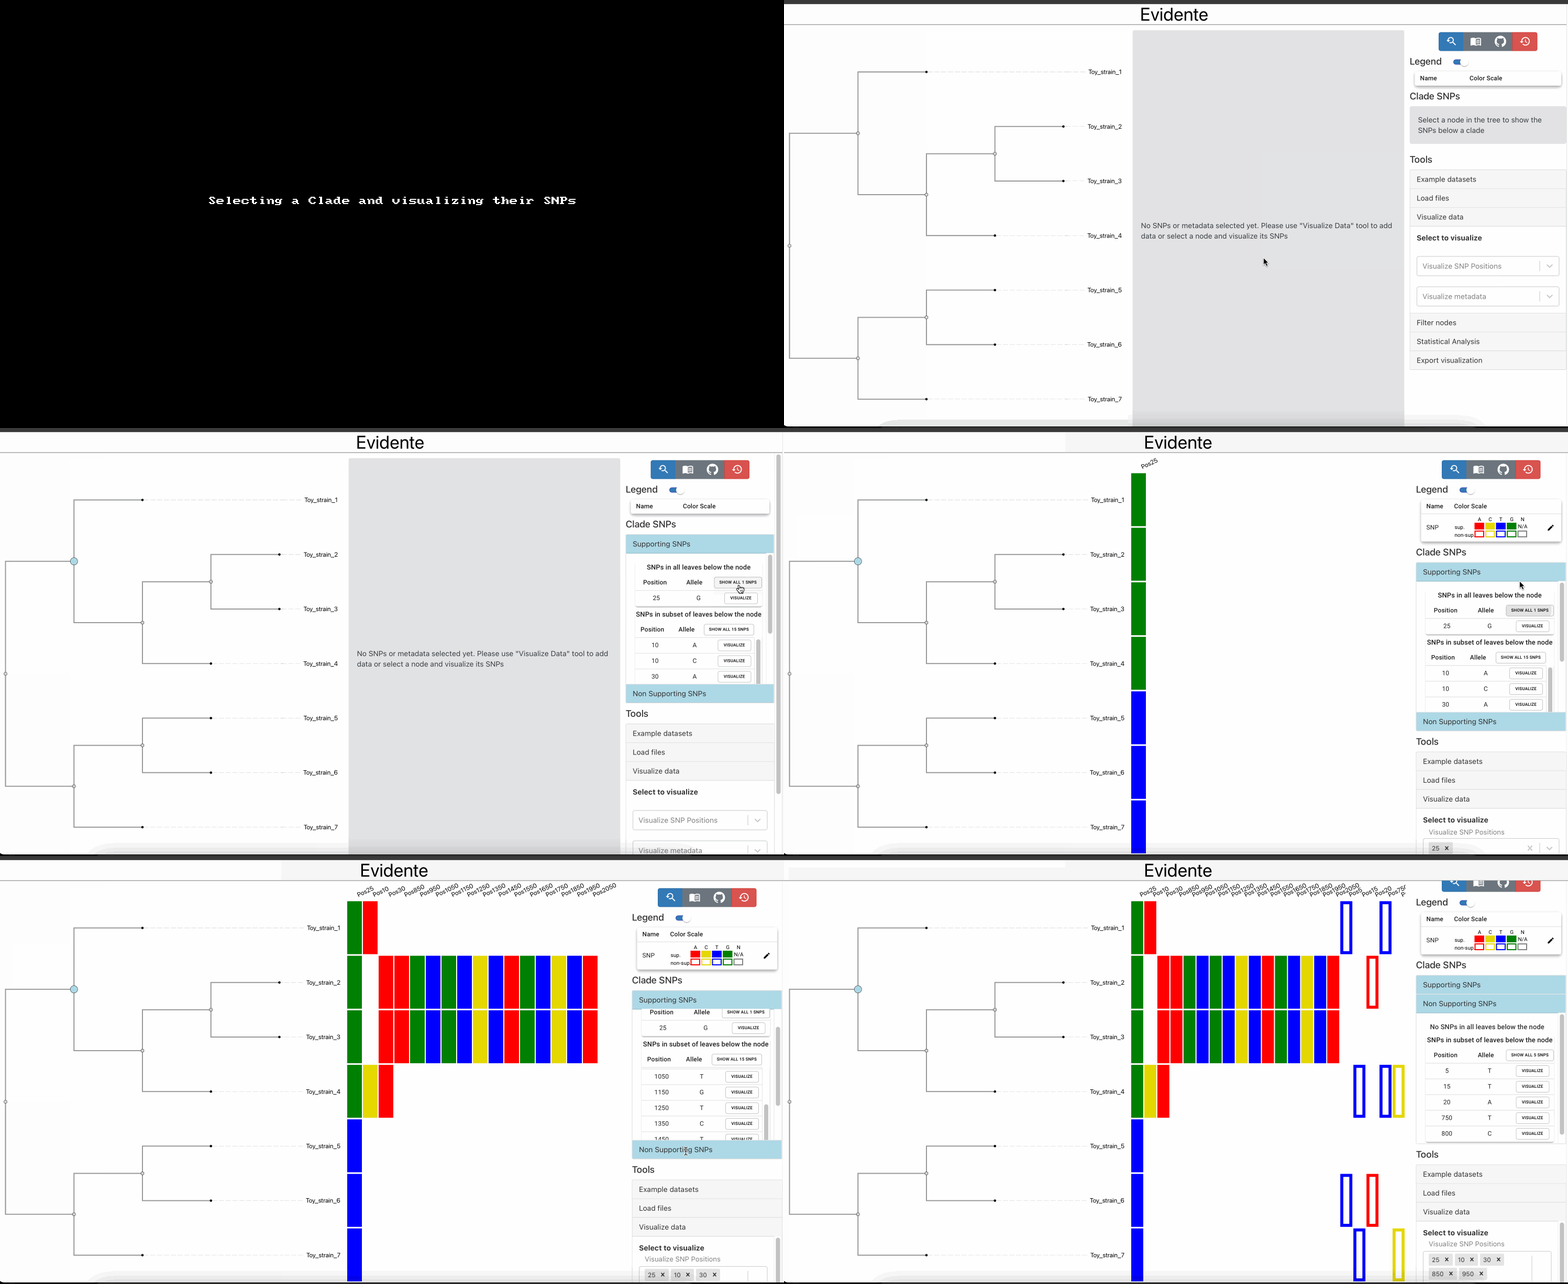
The user has the possibility of linking the phylogenetic tree and the SNP data by selecting one internal node of the tree and list all SNPs found within the tree. Here two lists are created for supporting and non-supporting SNPs: one showing SNPs that are present in all leaves of the clade, and one showing SNPs present only in a subset of the nodes. The user visualize all SNPs from each list, or select individual SNPs for their visualization.
As an interactive visual analytics tool, Evidente allows the user to zoom in (via a scroll interaction) and pan (via dragging) the visualisations. The vertical axis is synchronised across all components to maintain the alignment. The horizontal zooming (ctrl + scrolling) and panning (ctrl + panning) is independent for each component.

The user can use the button "Reset zoom" to return the visualization to its original state.

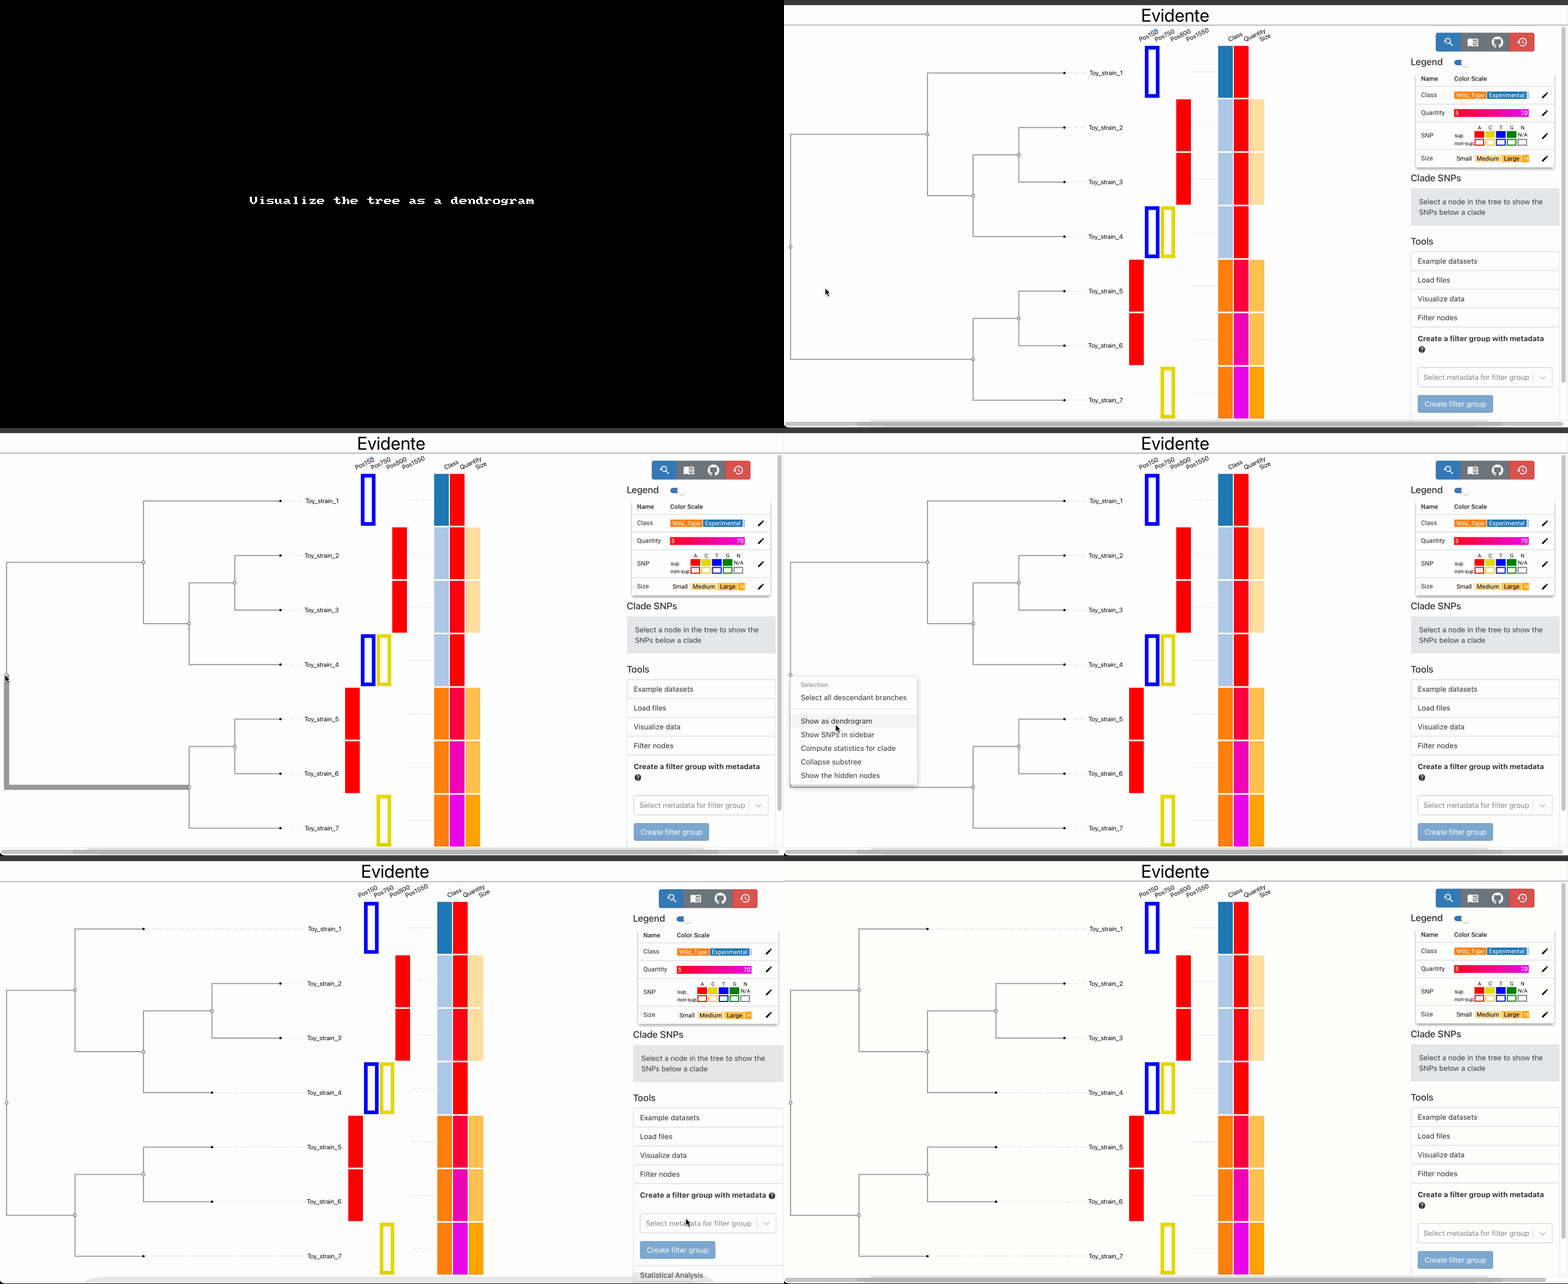
Evidente allows the user to visualize the phylogenetic tree as a dendrogram a dendrogram (i.e., a tree visualization that includes the branch lengths in the visualization), the user can interactively visualize the data as a cladogram, a visualization of the tree that focuses only in the descendent-ancestor relationship without including distances.
This is done by clicking on the root node of the phylogenetic tree and selecting the option "Show as cladogram/dendrogram".
If some clades of the phylogenetic tree are not relevant for a specific question, these can be hidden directly from the phylogenetic tree by clicking the root of the clade. To show the clade again any internal node above the hidden clade can be used to show all hidden nodes.

Evidente also allows the user to automatize the hiding of some clades by using metadata. For this automatic filtering, the user needs to create one or many "Filter Groups" in the corresponding menu of Evidente. A filter group defines a characteristic that a certain leaf needs to fulfil in order to be shown. When creating a filter group, the node needs to fulfil any of the given criteria (OR-junction of the rules). When many filter groups are created, a leaf needs to fulfil all criteria to be shown (AND-junction). By applying the filter groups, Evidente will prove which nodes fulfil the criteria and show them. If no node will be shown, the "Apply filter groups" function is disabled.

Besides removing specific leaves or clades from the visualisation, Evidente allows the user to aggregate clades into one single node that is visualised by a different glyph. This does not only reduces the amount of nodes in the tree, but summarizes all visualised data. All SNP columns, the ordinal and categorical data are summarised with a bar plot. Numerical data are summarised into box plots.
All visualisations produced in Evidente can be exported as PNG or PDF files. The legend of the visualisation moves in order to create more compact visualisation.