Physical Unclonable Functions (PUF) have received increased attention by the scientific community over the years. By utilizing non-reproducible and unpredictable manufacturing deviations, these specialized circuits generate unique chip fingerprints and thus can be used as on-chip replacement for power hungry and expensive secure key storage. Since 2016, Xilinx provides such a functionality as an integrated circuit, but limits its usage to Zynq UltraScale+ devices. On FPGAs, especially ring-oscillators are known to provide the most reliable readouts and, in combination with their easy implementation, provide an alternative for low-cost devices.
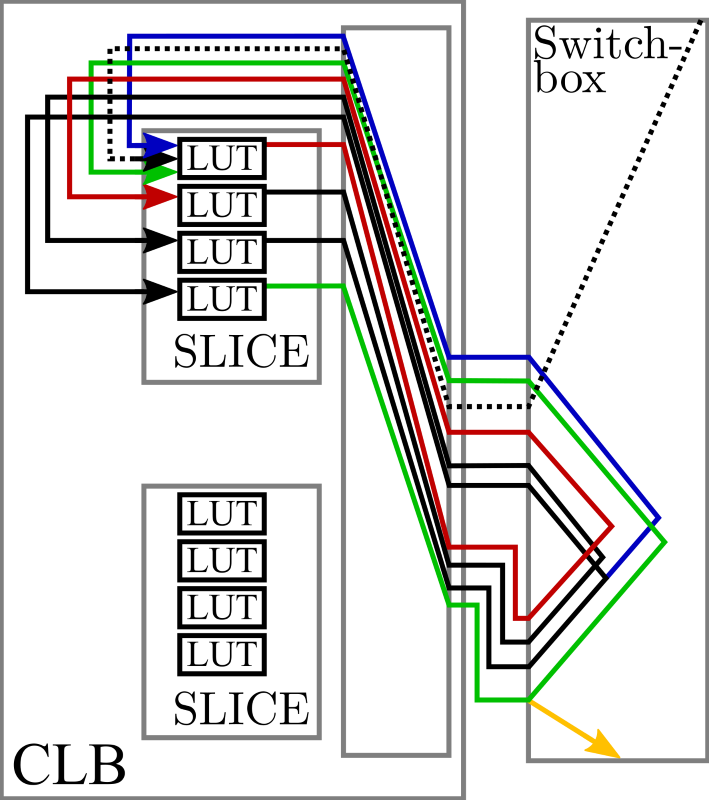
In this project, use ring-oscillators are used as a measurement tool for chip characterization. A ring-oscillator is build with all four Lookup-Tables in a single SLICE, interconnected with a fixed routing. By activating it for a specified time (evaluation time) and counting the number of oscillations as the number of rising edges at the ring-oscillators output, an individual frequency can be calculated. By successively placing ring-oscillators on the whole chip area, a frequency heatmap can be derived. This frequency heatmap can be used as an identification token itself or as a placement guide for PUF designers.
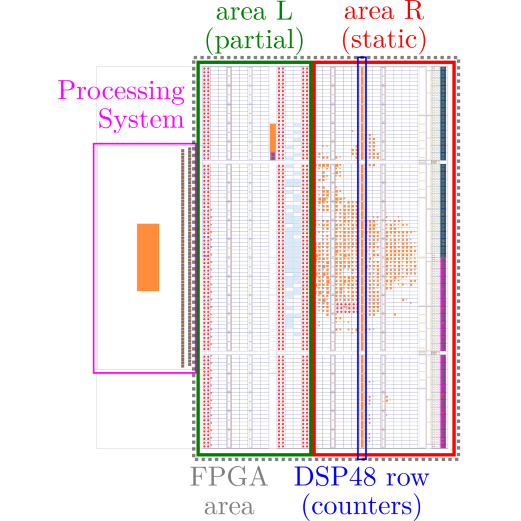
Full chip characterization is achieved by using Partial Reconfiguration. A small set of ring-oscillators is defined as a single Reconfigurable Module (RM) with one Reconfigurable Partition. An individual placement is created in a child implementation run which varies only in the constraints applied to that RM. In order to cover the whole chip area, two parent implementation runs are created. In one of them, the chip area is divided into a static area and a reconfigurable area, defined by a pblock. In the other parent run, these areas are changed in place. The static area is used for the static logic, like configuration, measurement and readout while the reconfigurable area is the target area for ring-oscillator placement.
Measuring the full chip is controlled by the Processing System, which runs a baremetal application. It loads the bitfiles from the SD-Card and programs them one after another to the PL using the PCAP. The application is controlled by the user over UART by writing defined commands over the assigned COM-Port. After setting specific measurement parameters, like number of readouts, evaluation time and mode of measurement, the application autonomously starts the measurements. The results are sent back to the user over UART for further use and analysis.
Results and analysis of a data set extracted from 20 boards were presented and published on the 2019 IEEE International Symposium on Hardware Oriented Security and Trust (HOST). The framework (project name: Partial Reconfiguration for chip characterization) was submitted to the Xilinx Open Hardware Design Contest 2019 and ranked as finalist in the PhD category.
This project is created in project-mode with a set of tcl-files provided as a framework. The whole setup flow is fully autonomous and only requires a pre-setup project with a defined board. All steps are organized in tcl-files numbered from 1 to 7, which have to be called one after another. In these steps, different task are fulfilled, like creating the static parts and toplevels, generating and running the partial child implementations, converting the bitstreams to bin files for the PCAP interface and creating/compiling the baremetal application.
The hardware is organized in a toplevel verilog module, which instantiates the block design wrapper and the measurement control module.
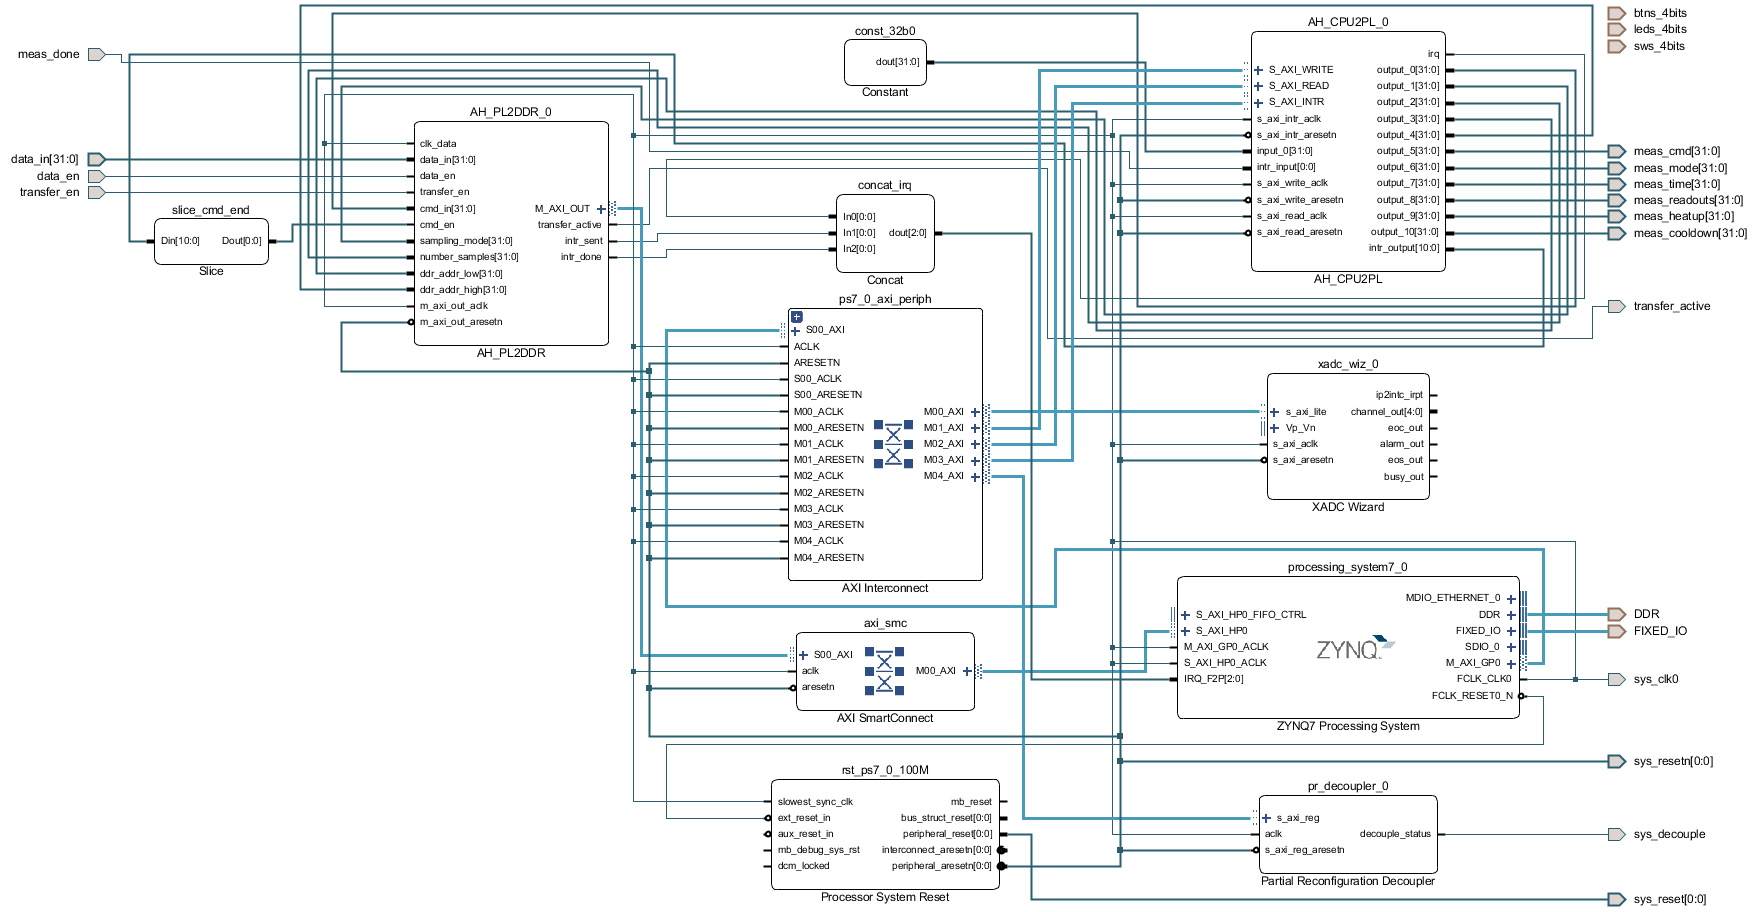
The block design system, shown in the following figure, functions as the interconnection between the software application and the measurement control module. Its main part consists of two custom IPs, which were designed for ease of usage in our institute by one of the authors. Their main purpose is to simplify access by the PS and data collection, e.g. for measuring analog chip outputs in the lab.
The first custom IP, called AH_CPU2PL, is an AXI4-Lite based tool which provides read and write access of single values from the PS. The amount of inputs and outputs can be varied separately and additional features such as IRQ to the PS and interrupts to the PL can be activated. The driver functions for this IP provide simplified functions for initialization, reading, writing and registering IRQ functions. In this project, the IP is used to write the specific measurement parameters and control commands to the PL and for IRQ based notification, when the measurement has completed.
The second custom IP, called AH_PL2DDR, is an AXI4-FULL data collection tool, which was specifically designed to ease collection of measurement values, either from chip internal sources or from custom analog chips. It utilizes a single BRAM instance to collect data of selectable bitwidth and transfer it to the DDR-RAM over the HP Ports independently. The data interfaces can be connected to its own clock and provides an enable port to maximize control of data collection. Parameters such as number of samples to be collected, sampling mode and DDR addresses can either be fixed at IP customization level or dynamically be written on a 32-bit input. These inputs can directly be connected to the IP AH_CPU2PL, which in turns enables software control over the data collection IP. Specific interrupts can be set such as transfer occurred or data collection complete. An additional interface controls whether the IP is allowed to transfer data or has to hold it, which is used in this project to prevent data transfers while the measurements are active.
Additional IPs used in the block design are the Partial Reconfiguration Decoupler for preventing glitch signals during reprogramming and the XADC Wizard for enabling temperature and voltage tracking during measurements. The usual connection IPs are used to connect the AXI4 based IPs to the Zynq Processing Systems.
The block design externalizes input and output ports, which are connected on the toplevel to the measurement control module in order to enable the correct interaction between the application software and the hardware measurements.
The PL sided measurements are controlled by the verilog module ro_toplevel. A measurement FSM starts a full measurement set when activated. In the state CHECK_NEXT_MEAS, it allows the IP AH_PL2DDR to start a transfer when more than 256 out of the maximum 1024 data points are ready to be transferred to the DDR-RAM. Afterwards, the synchronous reset of the timers and counters is triggered by switching to the state RESET_INIT and WAIT_RESET, which control the dedicated reset state machine. As the counters only clock source is the ring-oscillator output, these have to be activated for a short time to recognize the reset signal.
By setting specific bitmasks, different measurements modes are activated. First, a heatup run can be activated, which omits transferring the first readouts. Second, cooldown phases defined by a selectable number of clock cycles can be activated after each measurement. Third, the ring-oscillators can either be measured all at once (parallel) or one after another (serial).
Afterwards, the start signal for the timers is set, which in turn activates the selected ring-oscillator(s) for a specified time. When the selected timer has finished counting for a specific number of clock cycles, the state machine switches to the state SEND_READOUTS. In this state, the counter values are sent to the IP AH_PL2DDR by setting its data enable high and selecting the appropriate counter output with a multiplexer. For each measurement, a reference oscillator, contained in the static part of the PL, is also measured and transferred to the BRAM. Depending on the measurement mode, either the next ring-oscillator is selected (serial measurements) or the next readout set is activated (parallel measurements). When the full number of readouts is achieved, an interrupt register is set in CHECK_NEXT_MEAS and the state machine returns to its idle state.
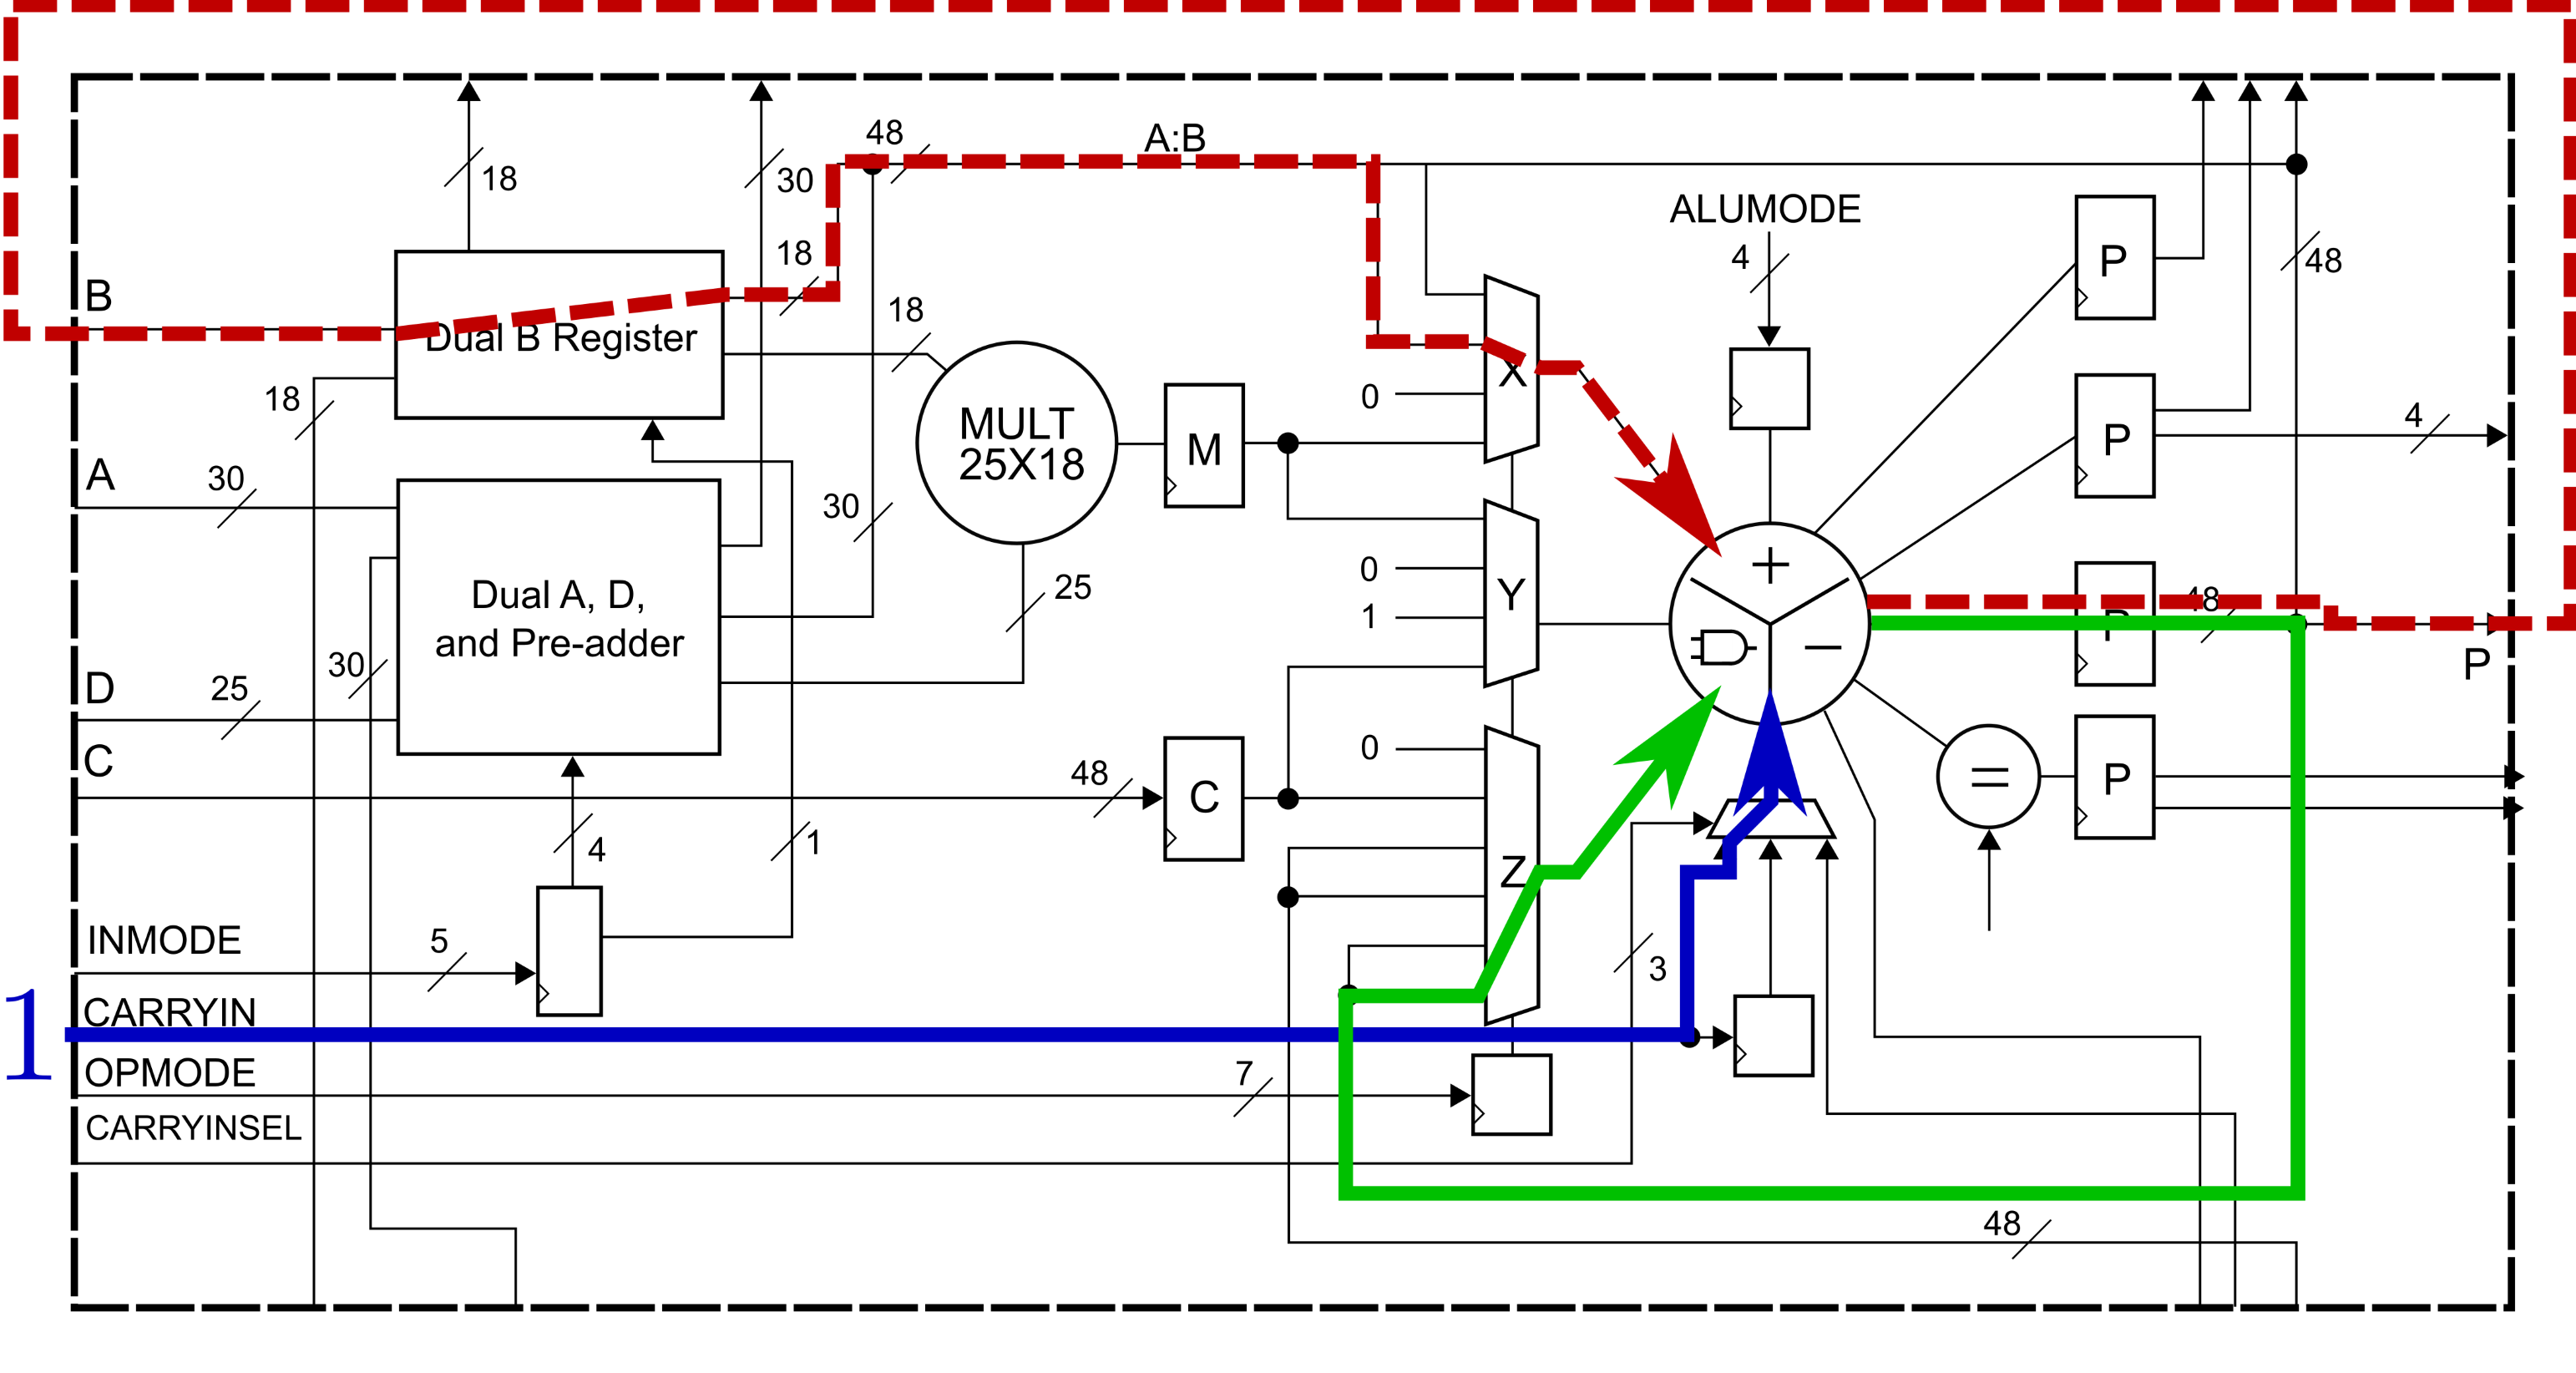
The timers used in this verilog module are custom instances of the DSP48 modules, parameterized as counters, which stop after a specified number of clock cycles, according to their intended evaluation time. The counters are also DSP48 modules with a custom parameter set, which routes the up-counting signals only internally, enabling the DSP48 counter for larger frequencies compared to the hard macros with external routing. The following figure shows a schematic view of the counters, which are explained in-depth in HOST2019.
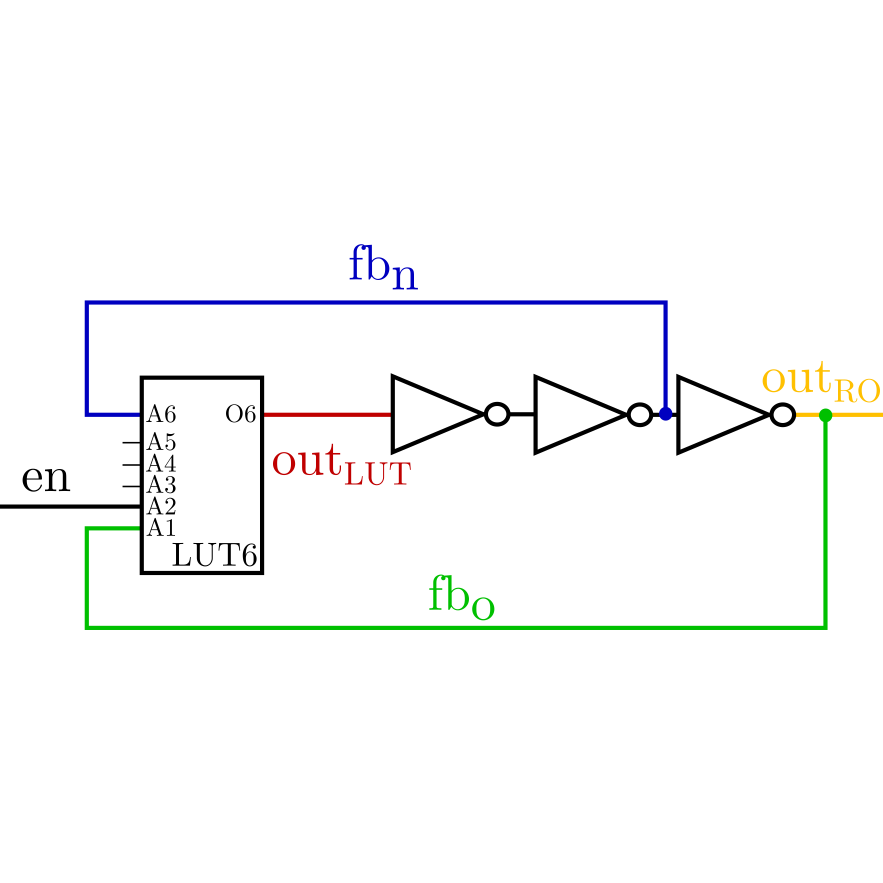
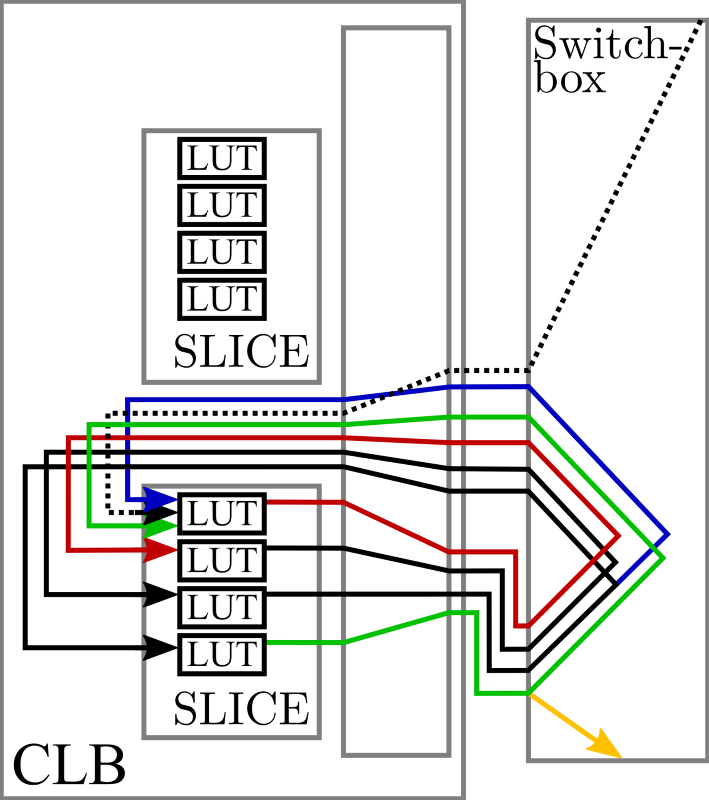
The ring-oscillators are implemented in the verilog module ro4.v, a schematic is shown the following figures.
Their only module ports are the input enable and the oscillation output. Four hard-macro instances of LUT6 elements are connected in series with an additional feedback from the last LUT6 to the first LUT6. The first LUT6 also controls whether the oscillation occurs, depending on the enable input. As the manual routing was intended to be as short as possible, each LUT has a different input setting, customized for the expected routing. The routing itself depends on the target SLICE and CLB type, thus can not be provided as a static constraint. More specifically, the routing is the same for all ring-oscillators but the net names differ sometimes, e.g. CLBLM_L_C5 in memory CLBs and CLBLL_LL_C5 in logic CBLs. Thus, for each real instance in a child implementation, the routing is decided dynamically based on the routing algorithm provided in the framework.
The software of the project is used to fully control all measurements by writing values over the IP AH_CPU2PL and thus heavily utilizes its driver functions. An additional library ah_lib is included, which was written in our institute (by one of the authors) for simplifying usage of different aspects of the Processing System. E.g. it provides custom wrapper functions for UART and TCP/IP communication, access to PCAP for reprogramming with either full or partial bitstreams, access to GPIO if their IPs were instantiated and access to the SD-Card.
The functionality of the the different parts of the measurement procedure is out-sourced to different .c and .h files, according to their functionality. A brief overview is given in the following list:
- fw_com - provides communication functions, messages can be send and received with FIFO order
- com_custom - wrapper functions for the specified communication protocol (UART in this project, can be switched to TCP/IP in the github project)
- fw_data - provides high-level functions for accessing and sending the measurement results
- fw_hw - provides low-level functions for writing to and reading from the interconnecting IPs and for loading and programming the binary bitfiles through the PCAP, used by many other high-level functions
- fw_meas - provides high-level functions for setting measurement parameters and control
- fw_impl_generated.h - contains parameters from Vivado project parameters
- fw_impl_custom.h - contains macros for setting the desired evaluation time
- fw_datatypes.h - contains definition of communication data structs included in other files
In the main() function (main.c), the initialization of the PS and library functionality is executed first and the DCache is disabled for proper functionality of the IP AH_PL2DDR.
A Finite-State-Machine (FSM), implemented as an infinite while-loop, builds the main core of the projects software. It periodically checks for new commands send by the user through the communication interface. Depending on the commands, it executes different task like setting up the chain of different measurements to execute, receive the order of binaries to be loaded for each measurement or even receiving files to be stored on the SD-Card (e.g. for updating the binary bitstreams).
When triggered by a command to start the measurements, the FSM then enters an automated task chain. For each defined measurement, it loads each bitstream one after another, starts the measurement process, waits for the IRQ notification from the PL and send the measurement results to the user through the communication interface. This process is repeated until all measurements are done and transferred. The FSM is designed in a mostly non-blocking way such that in the current state, the application does not wait for a specific event but only checks if it has occurred. This approach ensures that especially the communication pull function is called periodically, which is mandatory for an optional TCP/IP implementation.
The custom communication protocol, which is independent from the communication interface, works with a header of 4 bytes containing the length of the command to be executed. The next bytes then define the command and sub-command, followed by the optional data if needed. The measurement results, provided as 32-bit values from the PL, are send in the same order as they are sorted in the DDR-RAM, which is defined by the measurement mode and number of readouts. Each subset of data created from a single partial bitstream is proceeded by the temperatures measured before and after the measurement by the XADC.
In the following list the full set of commands is provided, which can be send to the PS over the COM-Port. The communication is build as a packet based protocol. Each packet begins with a header of 4 bytes, containing the total length of the following bytes, which the PS will interpret as a u32 variable. The next byte contains the command, followed by an more specific sub-command byte. If the respective command requires more data, it then follows in an individual order.
- Identifying
- command byte: 0x01
- sub-command byte: not specified
- File commands
- command byte byte: 0x02
- receive file, store to SD-Card, sub-command byte: 0x01
- length of filename: 2 bytes (u16)
- length of file: 4 bytes (u32)
- filename: variable number of bytes according to length of filename
- file: variable number of bytes according to length of file
- Bitstream commands
- command byte byte: 0x03
- receive the bitstream files to be loaded (in order of loading), store in list: sub-command byte: 0x01
- id (not load order): 2 bytes (u16)
- partial (0x01) / full (0x00) bitstream: 1 byte
- length of filename: 2 bytes (u16)
- filename: variable number of bytes according to length of filename
- delete list of bitstream order: sub-command byte: 0xF0
- Measurement commands
- command byte byte: 0x04
- receive measurements to be executed and their parameters, store in list: sub-command byte: 0x01
- id: 2 bytes (u16)
- mode parallel (0x01) / serial (0x00): 1 byte
- number of readouts: 4 bytes (u32)
- evaluation time (macro selection from fw_impl_custom.h): 4 bytes
- number of heatup oscillations (omitting storage): 4 bytes (u32)
- cooldown (in clock cycles after each measurement): 4 bytes (u32)
- start all measurement stored in list: sub-command byte: 0x03
- delete all measurements stored in list: sub-command byte: 0xF0
The following figure shows an exemplary bitstream command, storing the bitstream file T1.BIN in the list of bitstreams to be loaded, with the id 1 assigned.
Each command sent to the PS is acknowledged by sending back 3 bytes (no header): the command byte, the sub-command byte and a status byte indicating success (0x06, ACK) or failure (0x15, NACK) of the commands.
After sending the measurement start command, the PS also begins to stream the bytes received from the PL, which also comes in a defined order, depending on the measurement mode.
For each measurement, the list of bitstream files is iterated successively. For each bitstream file in the list, the current measurement is executed and the received data send as follows:
- temperate read from XADC before the measurement: 2 bytes (u16)
- temperate read from XADC after the measurement: 2 bytes (u16)
- measurement results packets, repetition defined by number of readouts:
- mode parallel
- measured ring-oscillators: 32 (RO_PER_BIN - number of ring-oscillators per bitstream, static parameter defined in the verilog measurement module) x 4 bytes (u32)
- reference ring-oscillator: 4 bytes (u32)
- mode serial
- measured ring-oscillator #1: 4 bytes (u32)
- reference ring-oscillator: 4 bytes (u32)
- measured ring-oscillator #2: 4 bytes (u32)
- reference ring-oscillator: 4 bytes (u32)
- ...
- measured ring-oscillator #32: 4 bytes (u32)
- reference ring-oscillator: 4 bytes (u32)
- mode parallel
The following figure shows an exemplary bytestream send by the PS after it received the measurement start command for a serial measurement. In the beginning, the command, sub-command and status are sent as an acknowledgment to the command, followed by the begin of the measurement results.
When measuring the Zybo, a total of 124 bitstream binaries are used. For parallel measurements with 10000 readouts, the expected data send from the board then sums up to: 124 binaries x (4 temperature bytes + 4 bytes x (32 ring-oscillators + 1 reference)) = 163680496 bytes. For serial measurements with 10000 readouts, the expected data send from the board then sums up to: 124 binaries x (4 temperature bytes + 4 bytes x (1 ring-oscillators + 1 reference) x 32)) = 317440496 bytes.
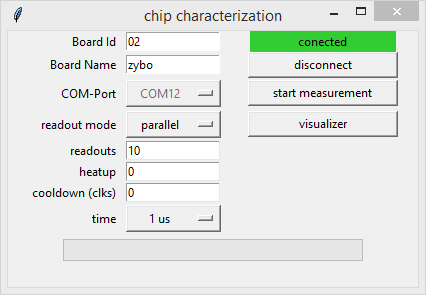
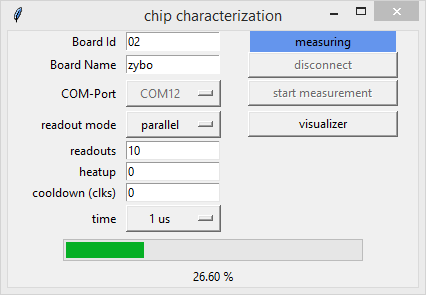
As the project itself is intended to be controlled by a user, an exemplary Python program is provided in the folder python. For installing the package dependencies, the python module checkPackages.py can be called. The python GUI for measuring and plotting can be started by calling the python module gui_controlPanel.py, its interface is shown in the following figures.
The files config.csv and params.csv, generated by the framework, have to be placed in the same folder. If a board name (e.g. ''zybo'') is used, the file names have to be adapted (e.g. config_zybo.csv and params_zybo.csv), which makes using different board types easier.
In the GUI, the user can connect to the Zybo over the correct COM-Port and set up the different measurement parameters. When the measurement is executed, the program receives the byte-stream from the board and writes it to different .csv files in the output folder, which are as follows:
- board_id_ro_data.csv - contains the readout values (column-wise) of the measured ring-oscillators (row-wise)
- board_d_ref_data.csv - contains the readout values (column-wise) of the reference ring-oscillator values for each ring-oscillator (row-wise)
- board_id_ro_x.csv - x-coordinates of the ring-oscillators SLICEs (row-wise)
- board_id_ro_y.csv - y-coordinates of the ring-oscillators SLICEs (row-wise)
An in-depth explanation of the data format can be found in [DATA].
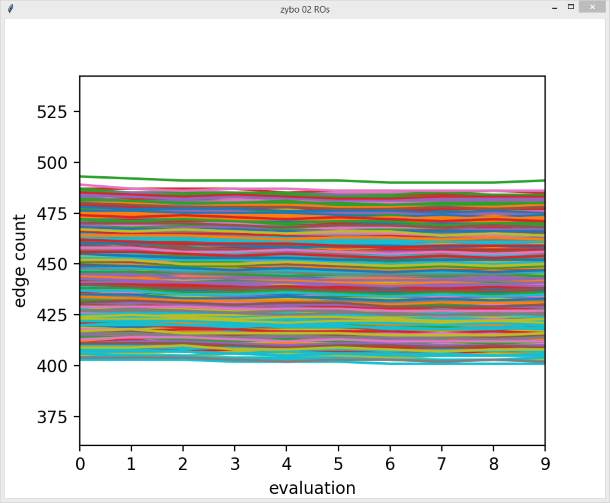
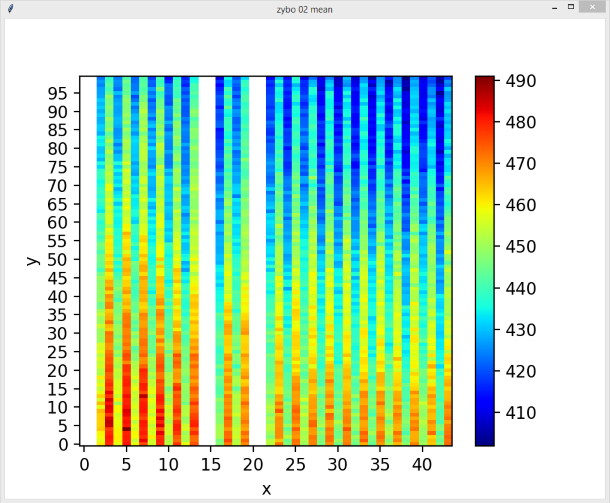
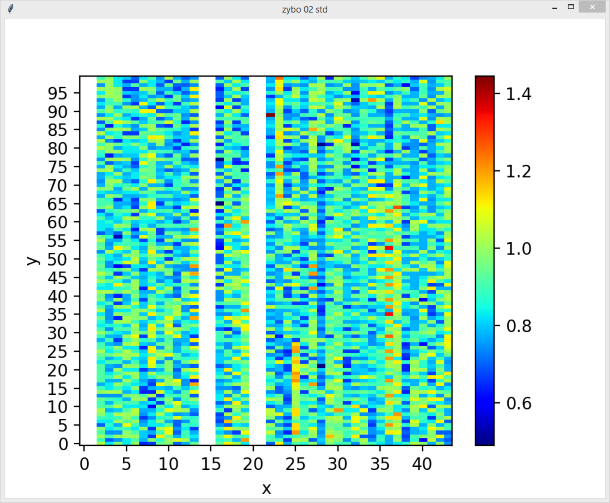
When the measurements are finished, a minimalistic visualizer can be started, which plots the results stored in the .csv output files. An example of the plot results is shown in the following pictures.
With the help of this framework, we could measure and analyze many statistics of the XC7Z010-1CLG400C on the Zybo. The full results were published in HOST2019.
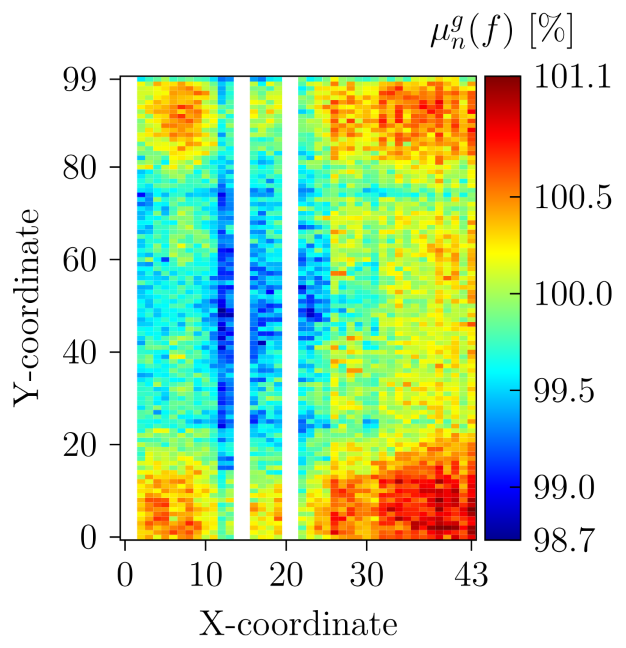
E.g. we identified a few coordinates on the chip, for which the extracted netdelays predicted a strong bias, which was confirmed by the measurement results. We could also show that the ring-oscillators in the corners of the FPGA have a slightly higher frequency then ring-oscillators in the middle of the chip, as shown in the following figure.
In addition, ring-oscillators in the top of the chip tend to have a larger deviation from their mean value. We also showed that the strongest noise deviations of ring-oscillators come from board wide disturbances as the measured counter values of an individual ring-oscillator showed deviations similar to the ones of the reference ring-oscillator. The measurement data were published in our University Open Access Repository OPARU.
Up to now, the project was used for the following boards:
These restrictions result from the fact that for each individual board, the external peripherials differ, e.g. the connected memory controller, the assignment of the COM-Port to either UART0 or UART1 etc. For different Zynq chips, the placement parameters differ, e.g. the possible areas of placement, the indices of non-reprogrammable SLICES.
- Xilinx Vivado Design Suite
- Project open in project flow created with a board file
For adaptions to other boards and Zynq chips, a few files have to be adapted:
- tcl/settings_compability.tcl - contains the functions check_board_supported and ps_apply_board_settings
- tcl/settings_project.tcl - contains coordinates of specific Zynq chips, describing the possible partial areas to be used, prohibited areas and the maximum dimensions
- sw_repo/ah_library/sw_services/data/ah_lib.tcl - checks for zynq family, makes gpio available for known boards
Apart from these files, creating the full project flow is generalized and the same for all boards and Zynq chips. First, the user has to create a project and only define the board in the last tab of the project creation wizard by selecting the intended board files (no other files included or created). Afterwards, the tcl files contained in the folder tcl have to be called in numerical order as follows:
- fw1_generate_filesets.tcl - imports all necessary files, creates the required filesets and creates the block design
- fw2_generate_partialflow.tcl - enables the Partial Reconfiguration flow, creates the partition definition and modules and the toplevel runs
- fw3_generate_statics.tcl - runs the synthesis and creates the static contraints
- fw4_generate_runs.tcl - creates the child implementation and its dedicated partial contraints
- fw5_run_impl.tcl - runs all implementation runs and generates all bitstreams
- fw6_convert_bin.tcl - converts the .bit files to .bin files for PCAP usage
- fw7_generate_sdk_projects.tcl - creates and compiles the baremetal application, the FSBL and the BOOT.BIN file
- fw8_extract_delays.tcl - extract all netdelays of the individual ring-oscillators from each implementation run
In general, by calling all the tcl scripts in order, the following work flow is executed. First, two static filesets are generated with static constraints as a base for two static implementation runs. They contain the definition of partial areas, timing constraints and place+route constraints for a static reference oscillator. With these two runs and the partial areas, the chip area is divided by half, as illustrated in the following figure. The static area contains all measurement control logic and the IPs from the block design. The partial area contains no logic at all, but will be filled with ring-oscillators when the file fw4_generate_runs.tcl is called. For the second parent implementation, both areas are swapped.
The algorithm in the file fw4_generate_runs.tcl loads pre-defined coordinate lists, which declare the chip area, areas which are capable of partial reconfiguration and areas which can not reconfigured. Two loops then iterate over each parent implementation and start to create their respective child implementation runs. This is done by opening the base synthesis run and placing ring-oscillators in a checkerboard like pattern as illustrated in the following figure.
In this example, one child implementation run uses the constraints, which places ring-oscillators in SLICEs marked with ''A'', another child implementation places them in SLICEs marked with ''B''. By running the placement algorithm until no further placement is possible, the whole chip area is successively covered. The placement algorithm itself can be found in the file help_create_constrsets_runs.tcl, but it only calculates coordinates at which ring-oscillators can be placed. For the placement itself, a sub-function defined in impl_place_route_ro4.tcl is then called with these coordinates propagated. With this hierarchical approach, it is easy to change the underlying ring-oscillator with a different implementation or even a different type of circuit.
Two necessary files for data analysis are created when the implementation runs are created.
The file config.csv contains a list of all ring-oscillators in the design as a comma-separated list. Each row identifies one ring-oscillator by its respective constraint set (e.g. constr_1_0032), a run identifier (e.g. t1i1r02), its index within the constraint set and its x- and y-coordinates. An additional 1/0 identifier at the end of each row provides information, if the placement was valid. The place+route algorithm always has to place the same amount of ring-oscillators. But when the boundaries of the chip are reached, some of them have to be ''misplaced'' and thus are marked invalid.
The file params.csv contains some additional information (row-wise) about the design itself: an identifier, the number off ring-oscillators per bitstream, the number of partial bitstreams for parent implementation 1 and 2, the total number of partial bitstreams and the file sizes of the .bin files.
A textual summary of the run creation is provided in the file placement_results.txt.
The framework flow following the creation of the partial constraint sets and runs is straight-forward. All runs are executed up to the step write_bitstream and the parent/child bitstreams are then converted to .bin files, which can be used to re-program the FPGA by loading them with the PCAP interface in the PS. Afterwards, xsct is used to create the SDK projects, generate the FSBL and compile the measurement .elf file. Finally, the initial toplevel bitstream, the FSBL and the application ELF are bind together as a bootable BOOT.bin file.
An optional file for extracting the net delays is provided as fw8_extract_delays.tcl. It re-opens each implementation run and extract the calculated net delays between the LUTs of the ring-oscillators and stores them in the files netdelays.csv and netdelays_ref.csv (for the reference ring-oscillators).
Apart from the Vivado project, the framework also creates a folder in the project folder with many additional files, listed as follows:
- bitstreams - folder containing all the converted .bin files and the file BOOT.BIN, to be placed on the SD-Card
- bitstreams/config.csv - file containing information about each ring-oscillator, e.g. coordinates and validity
- bitstreams/netdelays.csv - file containing netdelays of each net of each ring-oscillator
- bitstreams/netdelays_ref.csv - file containing netdelays of each net of both reference ring-oscillator (one per parent implementation)
- bitstreams/params.csv - file containing implementation parameter, e.g. number of ring-oscillators per binary and binaries per parent implementation
- bitstreams/placement_results.txt - file with additional information about the placements
- constr - folder containing all generated constraints per child implementation run
- sdk - folder containing generated files to be used in the baremetal application, e.g. fw_impl_generated.h and the .bif file
- tcl - folder containing additional .tcl files with variable content
- tcl/settings_jobs.tcl - file providing settings for running the implementations with multiple jobs
Place the file BOOT.bin on a SD-Card and connnect it to the repsective board, set the jumpers correctly for SD-Card boot.
An exemplary matlab framework for measuring is provided in the sub-folder "matlab", with the most important files listed as follows:
- fw_custom_settings.m - contains all settings required for the measurements setup, e.g. number of readouts, mode of measurement but also setup specfic settings such as communication protocol and board type
- fw_meas_control.m - exemplary measurement loop for multiple boards and possibly temperature control
Exemplary matlab files for post-processing measurement data files are provided in the sub-folder "matlab", with the most important files listed as follows:
- import_csv.m - converts the .csv output files into matlab files required in the data extraction
- read_data.m - read the measurements, extract the data from binary files created in fw_meas_control and stored them as matlab files
This project is licensed under the GNU General Public License v3.0 License - see the file for details
