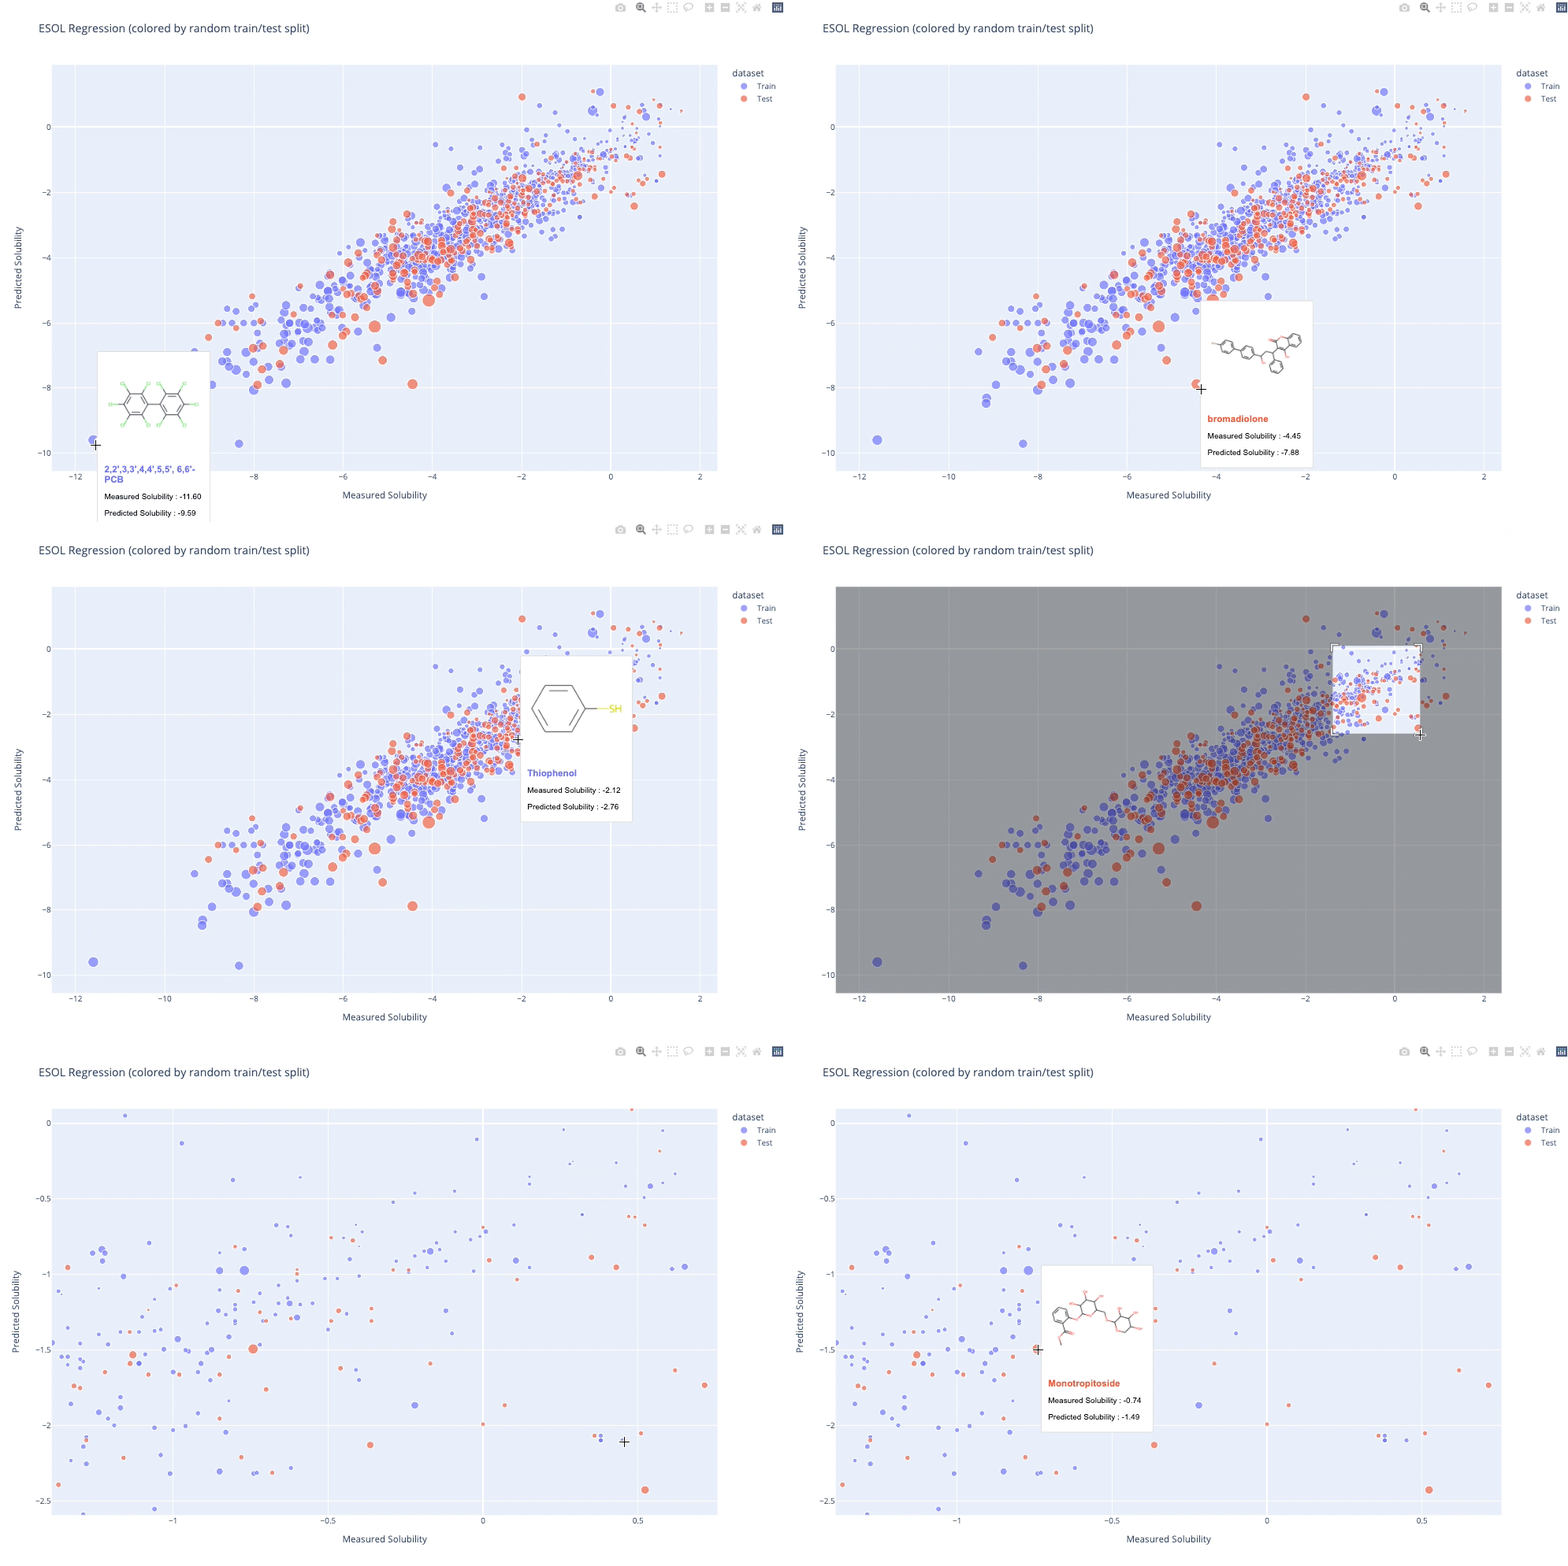
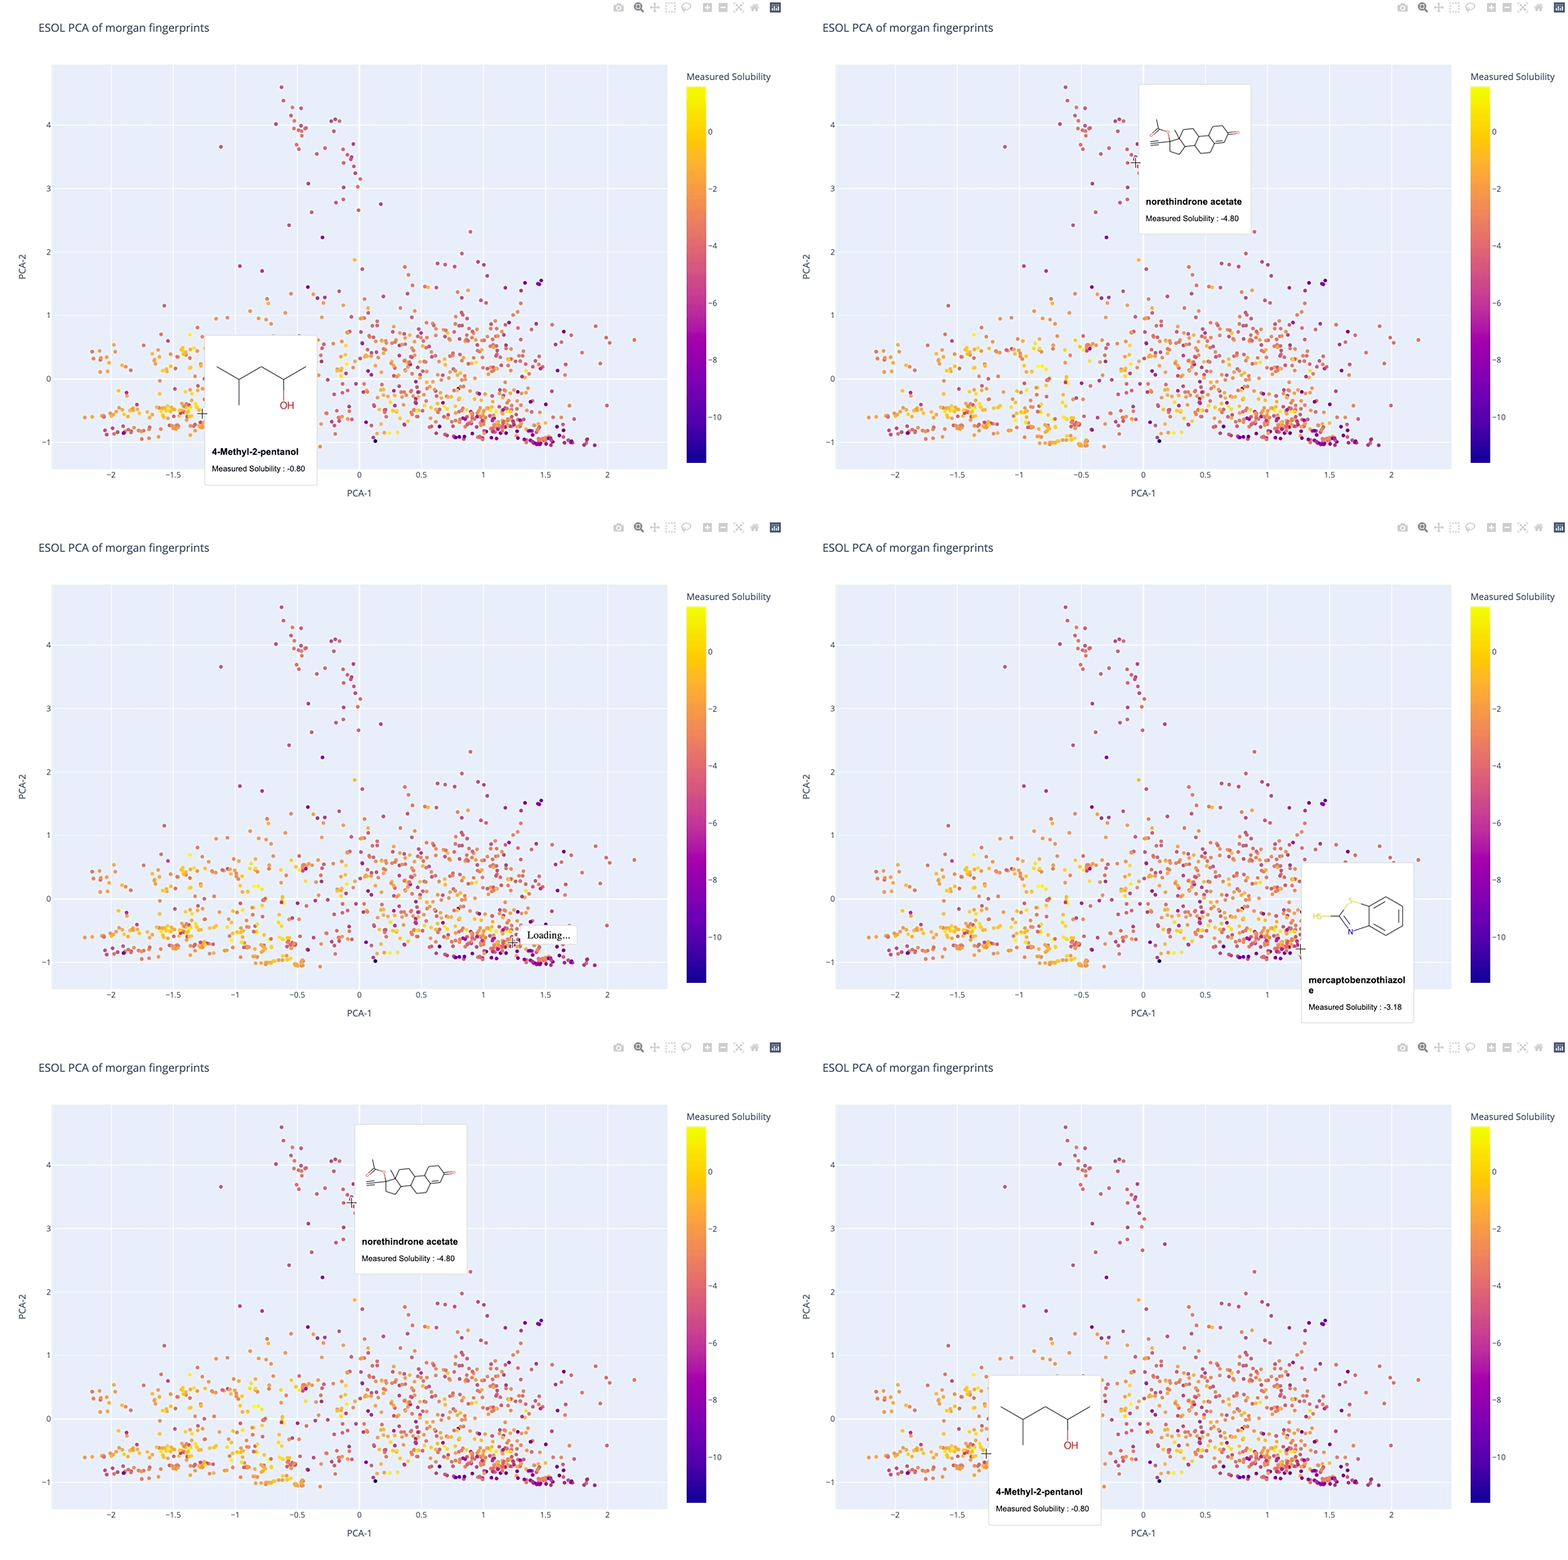
molplotly is an add-on to plotly built on RDKit which allows 2D images of molecules to be shown in plotly figures when hovering over the data points.
➡️ A readable walkthrough of how to use the package together with some useful examples can be found in this blog post while a runnable notebook can be found in example.ipynb :)
pip install molplotly
conda install rdkitimport pandas as pd
import plotly.express as px
import molplotly
# load a DataFrame with smiles
df_esol = pd.read_csv('esol.csv')
df_esol['y_pred'] = df_esol['ESOL predicted log solubility in mols per litre']
df_esol['y_true'] = df_esol['measured log solubility in mols per litre']
# generate a scatter plot
fig = px.scatter(df_esol, x="y_true", y="y_pred")
# add molecules to the plotly graph - returns a Dash app
app = molplotly.add_molecules(fig=fig,
df=df_esol,
smiles_col='smiles',
title_col='Compound ID',
)
# run Dash app inline in notebook (or in an external server)
app.run_server(mode='inline', port=8011, height=1000)-
fig: plotly.graph_objects.Figure object
a plotly figure object containing datapoints plotted from df -
df: pandas.DataFrame object
a pandas dataframe that contains the data plotted in fig -
smiles_col: str, optional
name of the column in df containing the smiles plotted in fig (default 'SMILES') -
show_img: bool, optional
whether or not to generate the molecule image in the dash app (default True) -
title_col: str, optional
name of the column in df to be used as the title entry in the hover box (default None) -
show_coords: bool, optional
whether or not to show the coordinates of the data point in the hover box (default True) -
caption_cols: list, optional
list of column names in df to be included in the hover box (default None) -
caption_transform: dict, optional
Functions applied to specific items in all cells. The dict must follow a key: function structure where the key must correspond to one of the columns in subset or tooltip. (default {}) -
color_col: str, optional
name of the column in df that is used to color the datapoints in df - necessary when there is discrete conditional coloring (default None) -
wrap: bool, optional
whether or not to wrap the title text to multiple lines if the length of the text is too long (default True) -
wraplen: int, optional
the threshold length of the title text before wrapping begins - adjust when changing the width of the hover box (default 20) -
width: int, optional
the width in pixels of the hover box (default 150) -
fontfamily: str, optional
the font family used in the hover box (default 'Arial') -
fontsize: int, optional
the font size used in the hover box - the font of the title line is fontsize+2 (default 12)
by default a JupyterDash app is returned which can be run inline in a jupyter notebook or deployed on a server via app.run_server()
- The recommended
heightof the app is50+(height of the plotly figure). - For the
portof the app, make sure you don't pick the sameportas anothermolplotlyplot otherwise the tooltips will clash with each other!
JupyterDash is supposed to have support for Google Colab but at some point that seems to have broken... Keep an eye on the raised issue here!
moltplotly works using a Dash app which is non-trivial to export because server side javascript is needed in addition to HTML/CSS styling (as detailed here)
Until I find a way to get around that, the best alternative is exporting the plotly figure without molecules showing :( as detailed in this page. If you want to use it in a presentation I'd suggest keeping the figure open in a browser and changing windows to it during your talk!
Just adding a warning here that memory usage in a notebook can increase significanly when using plotly (not molplotly's fault!). If you notice your jupyter notebook slowing down, plotly itself is a likely culprit... In that case I'd consider either using plotly with static image rendering, or ... use seaborn :P


