The Iris Data Set was created by R.A Fisher and it is widely used in Machine learning to test algorithms It is a multivariate Data Set which by definition contains multiple variables of points for analysis. It is one of the most widely used data sets in Machine Learning and Pattern Recognition It is used often for supervised and unsupervised classification tasks. The data set can be found widely online.
- Script is written in Python 3.6 - execture flowerscript.py to calculate the summary stats mentioned below.
-
It is possible to plot simple data effectively just using the matplotlib - there is an excellent article by Gilbert Tanner which outlines a variety of visualisation methods for the Iris Data Set here. Data Visualisation in Python "Examples and code")
-
Running Gilbert's basic script using matplotlib results in the following image: gilbert tanner matplot scatter plot "Gilbert Tanner Matplot example")
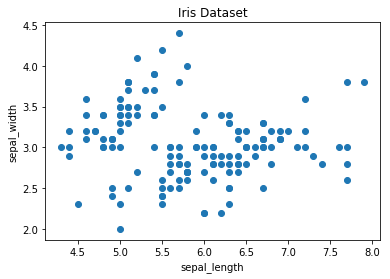
-
Sepal length
-
Sepal width
-
Petal length
-
Petal width
| Data | sepallength | sepalwidth | petallength | petalwidth |
|---|---|---|---|---|
| count | 150.000000 | 150.000000 | 150.000000 | 150.000000 |
| mean | 5.843333 | 3.054000 | 3.758667 | 1.198667 |
| std | 0.828066 | 0.433594 | 1.764420 | 0.763161 |
| min | 4.300000 | 2.000000 | 1.000000 | 0.100000 |
| 25% | 5.100000 | 2.800000 | 1.600000 | 0.300000 |
| 50% | 5.800000 | 3.000000 | 4.350000 | 1.300000 |
| 75% | 6.400000 | 3.300000 | 5.100000 | 1.800000 |
| max | 7.900000 | 4.400000 | 6.900000 | 2.500000 |
- https://github.com/rasbt/pattern_classification/blob/master/machine_learning/supervised_intro/introduction_to_supervised_machine_learning.md
- reference for read csv https://www.datacamp.com/community/tutorials/pandas-read-csv
- https:/nn/www.kaggle.com/jchen2186/machine-learning-with-iris-dataset #adapted from shawnly https://www.shanelynn.ie/python-pandas-read_csv-load-data-from-csv-files/