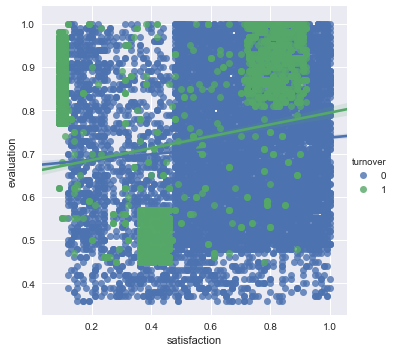
# Get a quick overview of what we are dealing with in our dataset 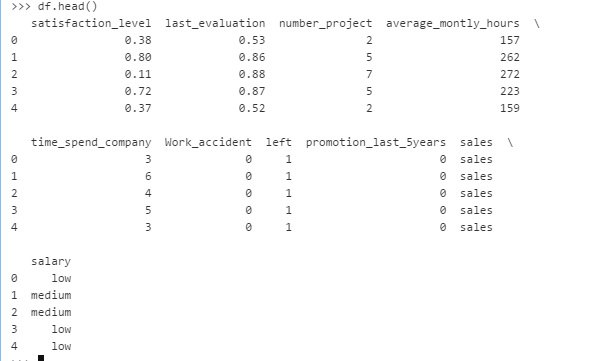 # Move the reponse variable "turnover" to the front of the table 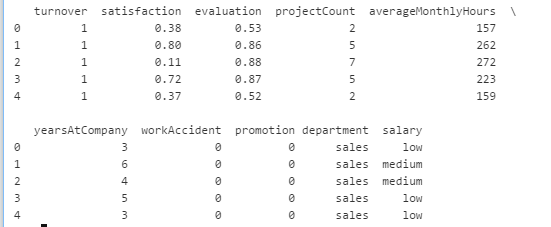 # Check the type of our features. 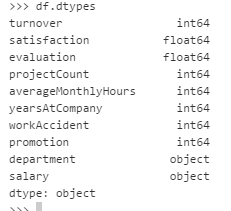 # Display the statistical overview of the employees 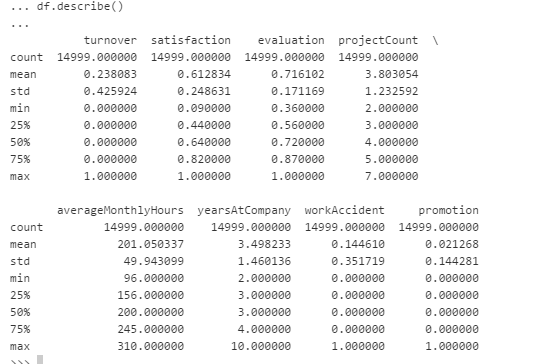 # Overview of summary (Turnover V.S. Non-turnover) 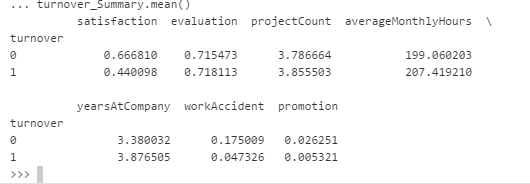 # Correlation Matrix 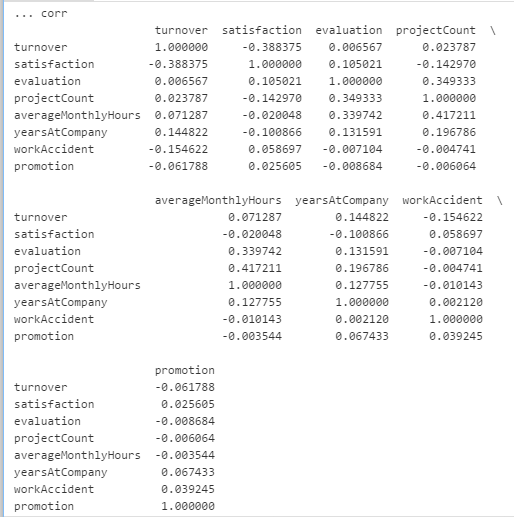 # Heatmap 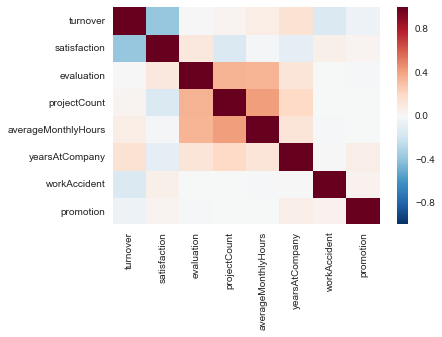 # Graph Employee Satisfaction 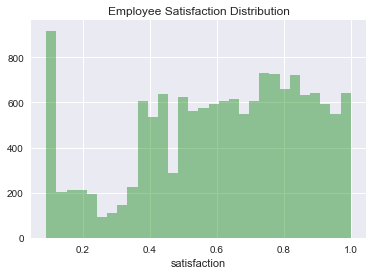 # Let’s have a look at boxplot of years at company vs average monthly hours 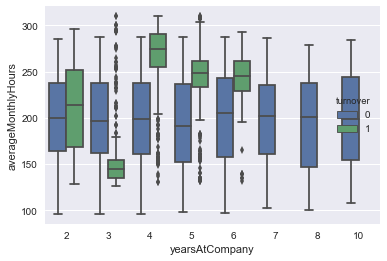 # Let’s have a look at lmplot satisfaction vs evaluation and print regression line