Incorrect overall statistics due to cycle boundary issues #181
Description
Overview
The arrivals on red chart indicates the total number of detector hits, the total arrivals on red, and the percentage arrivals on red. These statistics do not represent 100% of the data between the start datetime and the end datetime.
The code below accumulates these statistics. As indicated in line 116, it only accumulates data for cycles where the cycle start time is greater or equal to the start time of the bin and the cycle end time is less than the end time of the bin.
ATSPM/MOE.Common/Business/ArriveOnRedChart.cs
Lines 115 to 118 in d537e80
Relationship to Bin Size
This is an issue for both 15 minute and 5 minute bins, but is most prevalent on 5 minute bins, where more than 50% of the data is not counted when cycle lengths are more than 150 seconds (the percentage of data not counted is about equal to the cycle length as a percentage of the bin size).
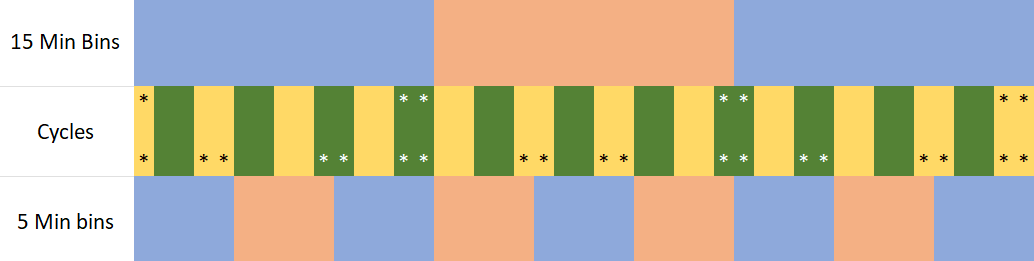
The image below shows what data is lost for a 120 second cycle length with both 15- and 5-minute bins. The asterisks indicate the data which is not counted.
Real Data Example
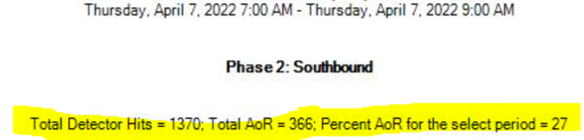
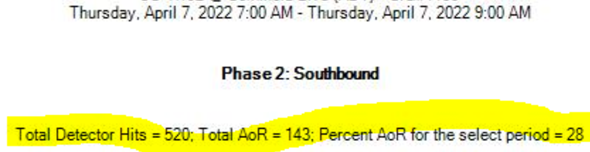
The following is data from a real signal, the first one uses 15 minute bins, the second uses 5 minute bins. Cycle length is about 220 seconds here.
15 minute bins:
5 minute bins:
Proposed Resolution
We propose to include the boundary cycles (one before and one after the cycles already selected using line 116 above) in the calculation, with an additional check for the detection timestamp to be within the bin times.
We will be working on implementing this proposed fix on our fork in the coming weeks.