





MultiModel Analysis is a Python framework designed to automate model benchmarking, evaluation, and visualization for Supervised Machine Learning tasks (Classification and Regression). It provides a unified interface for training multiple baseline models, computing statistical evaluation metrics, generating diagnostic visualizations, and identifying optimal model candidates.
- Overview
- Design Architecture
- Supported Estimators
- Installation
- Quick Start Guide
- API Reference & Complete Function List
- Function Code Reference Guide (
func_code.md) - Evaluation Metrics
- Dependencies
- License and Citation
Selecting an appropriate estimator for a given tabular dataset requires benchmarking multiple baseline algorithms. Manually executing model fitting, cross-validation, feature scaling, metric aggregation, and plotting leads to repetitive code overhead.
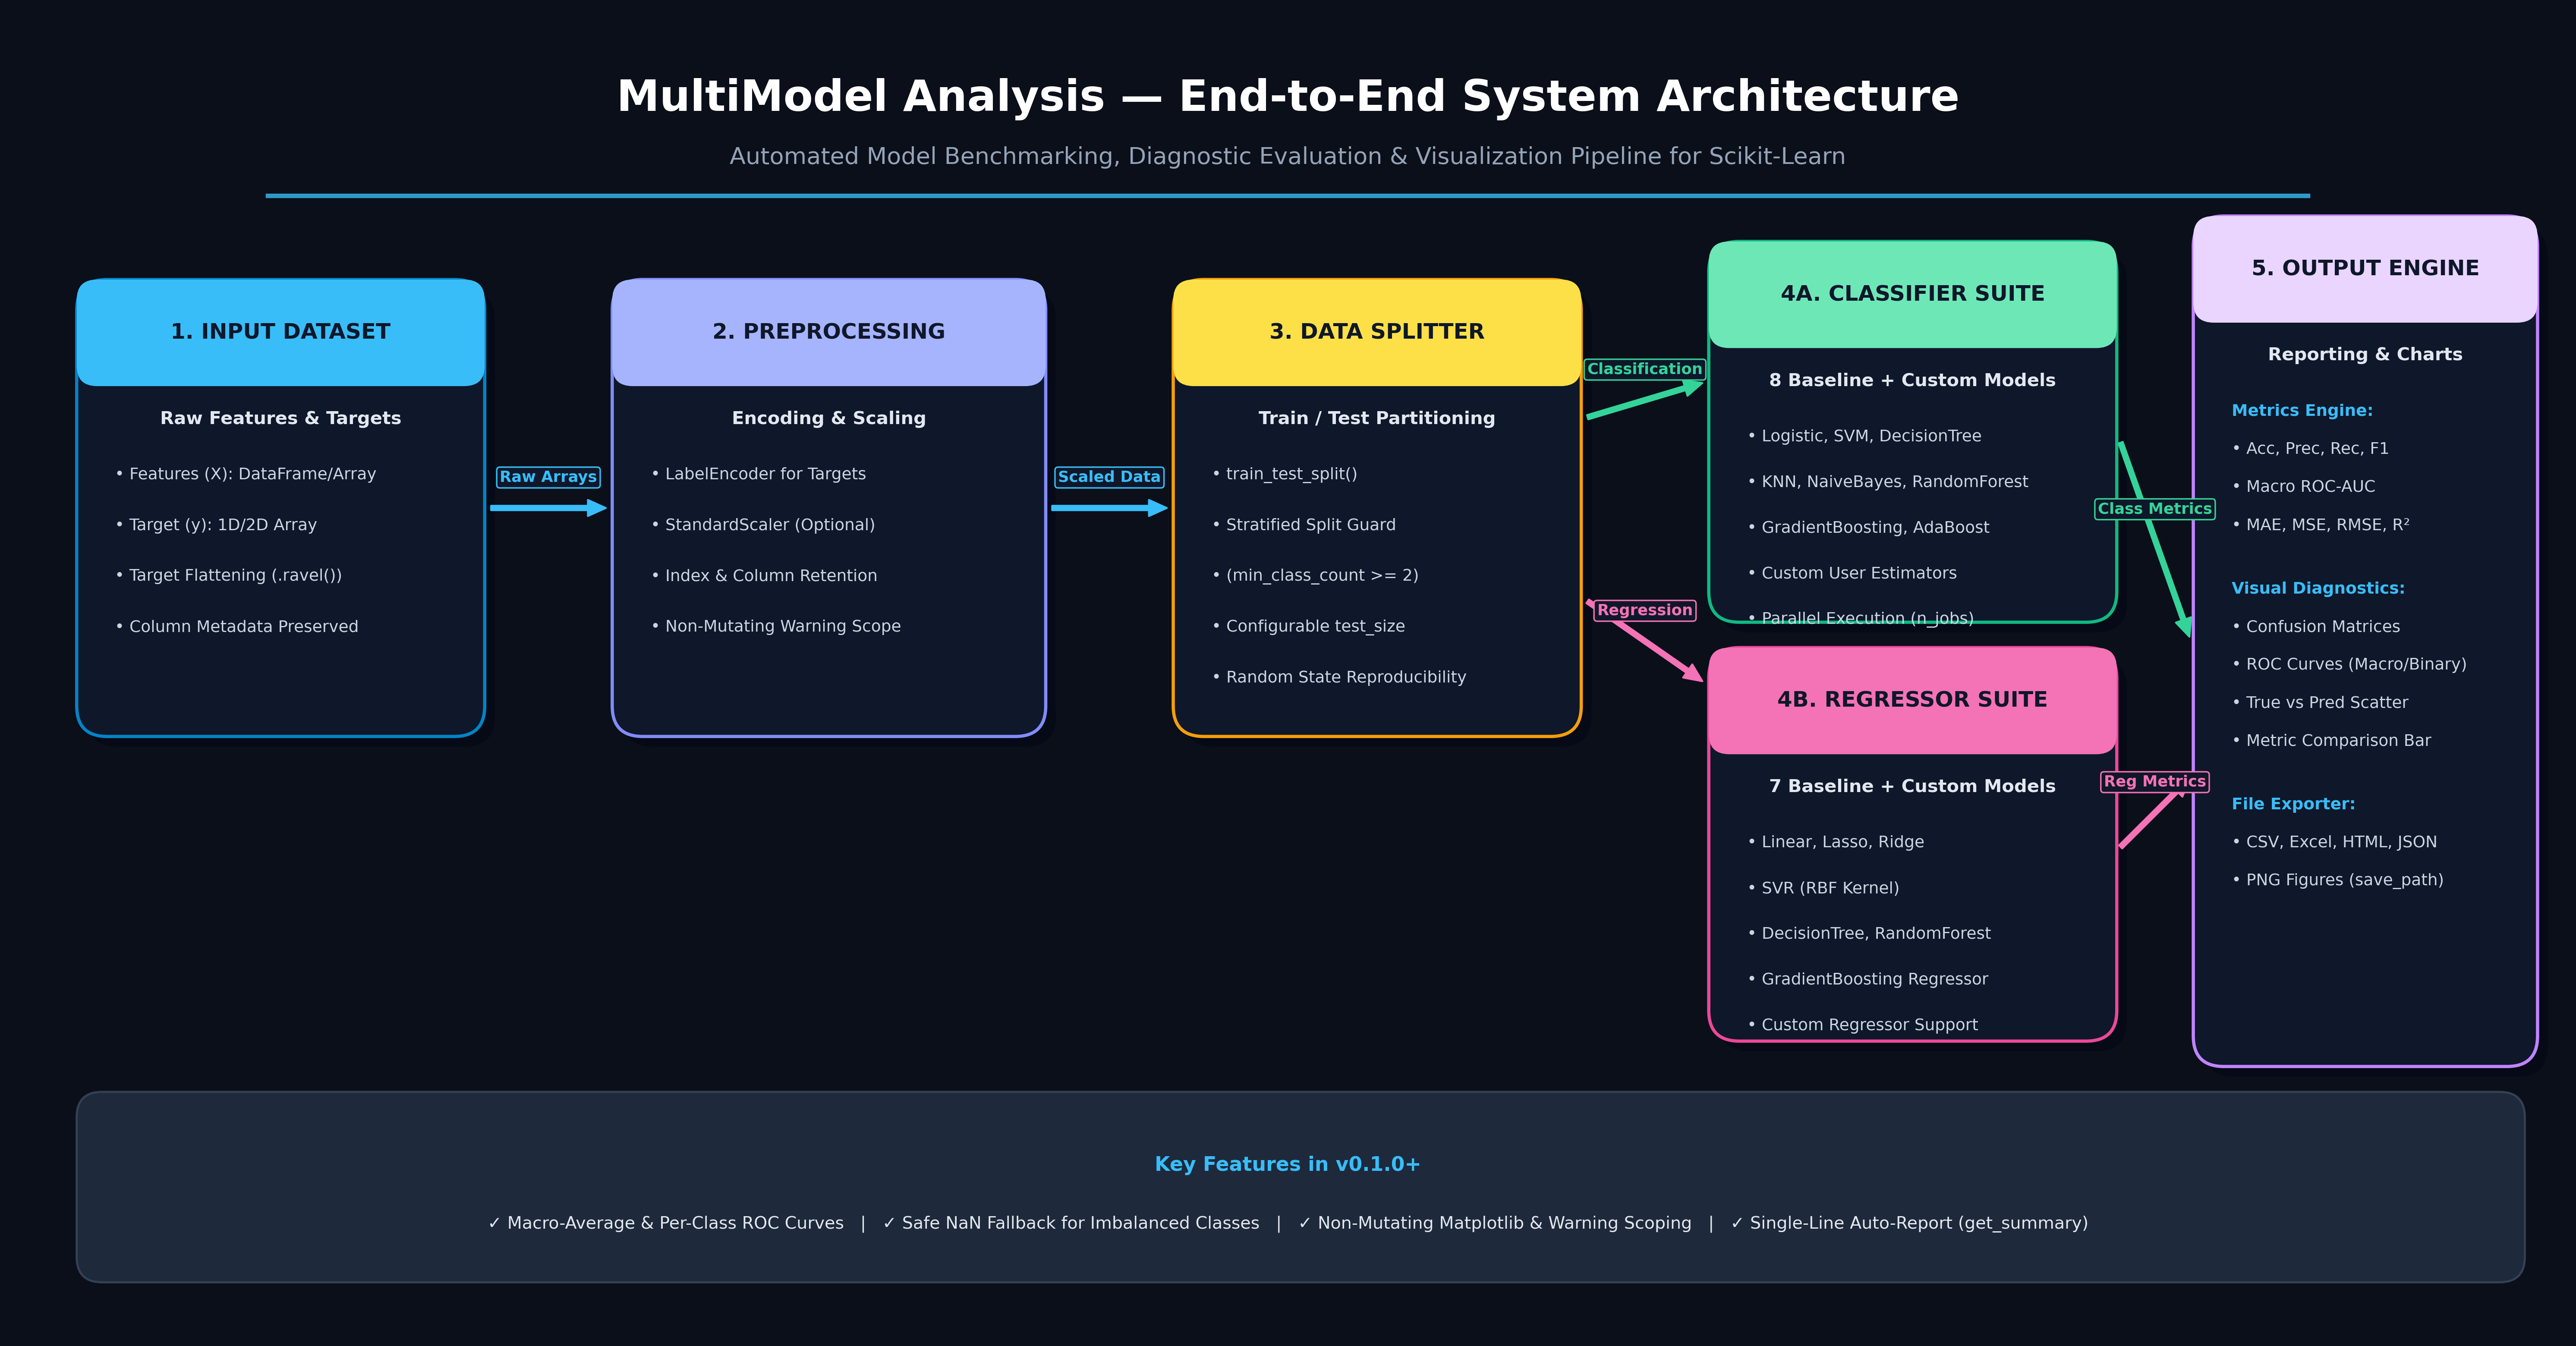
multimodel_analysis streamlines this process by implementing an automated execution pipeline:
- Automated Preprocessing: Applies standard scaling (
StandardScaler) while preserving pandas DataFrame structure and column metadata. - Label Encoding: Encodes target arrays (
LabelEncoder) to support numerical, string, and categorical target types across binary and multiclass tasks. - Stratified Splitting: Implements stratified train-test splits (
train_test_split) for classification tasks to maintain target class proportions. - Fault-Tolerant Training: Wraps individual model evaluations in isolated execution blocks to prevent full execution failure if a single estimator encounters a fitting exception.
- Metric Calculation & Visualization: Computes standardized evaluation metrics and renders diagnostic plots (Confusion Matrices, ROC Curves, Residual/Prediction Scatter plots, and Bar Charts).
- Headless & File Exporting: Supports saving report tables directly to CSV, Excel, HTML, or JSON, and saving plot charts to PNG files without requiring an interactive display window.
- Logistic Regression (
LogisticRegression) - Support Vector Machine (
SVC) - Decision Tree Classifier (
DecisionTreeClassifier) - K-Nearest Neighbors (
KNeighborsClassifier) - Gaussian Naive Bayes (
GaussianNB) - Random Forest Classifier (
RandomForestClassifier) - Gradient Boosting Classifier (
GradientBoostingClassifier) - AdaBoost Classifier (
AdaBoostClassifier) - Custom Estimators: User-supplied scikit-learn compatible classifiers.
- Linear Regression (
LinearRegression) - Lasso Regression (
Lasso) - Ridge Regression (
Ridge) - Support Vector Regressor (
SVR) - Decision Tree Regressor (
DecisionTreeRegressor) - Random Forest Regressor (
RandomForestRegressor) - Gradient Boosting Regressor (
GradientBoostingRegressor) - AdaBoost Regressor (
AdaBoostRegressor) - Custom Estimators: User-supplied scikit-learn compatible regressors.
pip install multimodel-analysispip install git+https://github.com/udityamerit/Multimodel-Analysis-Pacakge.gitimport pandas as pd
from multimodel_analysis import MultiModelClassifier, save_report
# 1. Prepare features and target variable
df = pd.read_csv("dataset.csv")
X = df.drop(columns=["target"])
y = df["target"]
# 2. Instantiate MultiModelClassifier
classifier = MultiModelClassifier(
X=X,
y=y,
test_size=0.3,
scaled_data=True,
random_state=42,
stratify=True,
n_jobs=-1
)
# 3. Train all classification models (with optional random_state parameter)
results = classifier.run_all_models(random_state=42)
# 4. Display tabular performance report (models argument is optional!)
df_report = classifier.show_tabular_report(return_df=True)
# 5. Export tabular report to disk
save_report(df_report, "classification_report.csv")
# 6. Render & save diagnostic figures
classifier.plot_confusion_matrices(save_path="confusion_matrix.png")
classifier.plot_roc_curves(save_path="roc_curve.png")
classifier.plot_comparison(save_path="metrics_comparison.png")
# Or run everything in one line:
classifier.get_summary(save_prefix="clf_run")import pandas as pd
from multimodel_analysis import MultiModelRegressor
# 1. Prepare features and target variable
df = pd.read_csv("housing.csv")
X = df.drop(columns=["Price"])
y = df["Price"]
# 2. Instantiate MultiModelRegressor
regressor = MultiModelRegressor(
X=X,
y=y,
test_size=0.3,
scaled_data=True,
random_state=42,
n_jobs=-1
)
# 3. Train all regression models
results = regressor.run_all_models(random_state=42)
# 4. Display tabular performance report (models argument is optional!)
regressor.show_tabular_report()
# 5. Render & save diagnostic figures
regressor.plot_true_vs_predicted(save_path="true_vs_pred.png")
regressor.plot_comparison(save_path="r2_comparison.png")
# Or run everything and export outputs in one line:
regressor.get_summary(save_prefix="reg_run")Saves a model comparison DataFrame to disk. Automatically infers format from file extension.
from multimodel_analysis import save_report

save_report(df, "report.csv")   # Saves as CSV
save_report(df, "report.xlsx")  # Saves as Excel Spreadsheet
save_report(df, "report.html")  # Saves as HTML Table
save_report(df, "report.json") # Saves as JSON Filedf(pandas.DataFrame, default=None): Report DataFrame returned byshow_tabular_report(return_df=True).filepath(str, default="report.csv"): Target file path with.csv,.xlsx,.xls,.html,.htm, or.jsonextension.
multimodel_analysis.MultiModelClassifier(
    X,
    y,
    test_size=0.3,
    scaled_data=False,
    random_state=42,
    stratify=True,
    n_jobs=-1
)X(pandas.DataFrame or numpy.ndarray): Feature matrix of shape(n_samples, n_features).y(pandas.Series, pandas.DataFrame, or numpy.ndarray): Target labels (binary or multiclass, numerical or string).test_size(float, default=0.3): Proportion of dataset for test split (between0.0and1.0).scaled_data(bool, default=False): Fits and appliesStandardScalerto features while preserving DataFrame columns and index metadata.random_state(int or None, default=42): Seed for train-test split and reproducible model initialization.stratify(bool, default=True): Performs stratified splitting when class sample counts allow (min_count >= 2).n_jobs(int or None, default=-1): Number of parallel CPU threads for estimators supportingn_jobs.
| Method | Parameters | Return Type | Description |
|---|---|---|---|
run_all_models() |
custom_models: dict = None, random_state: int = None |
list of tuple |
Fits all 8 built-in classifiers (plus optional custom estimators in custom_models). Returns a list of evaluation tuples. |
show_tabular_report() |
models: list = None, return_df: bool = False |
pandas.DataFrame or None |
Displays a formatted comparison table sorted by Accuracy and recommends the best model. Returns a DataFrame if return_df=True. |
plot_confusion_matrices() |
models: list = None, save_path: str = None, show_plot: bool = True |
None |
Plots confusion matrix heatmaps with original class labels for all models. Saves image if save_path is given. |
plot_roc_curves() |
models: list = None, save_path: str = None, show_plot: bool = True |
None |
Plots combined binary or macro-average ROC curves with AUC scores. Saves image if save_path is given. |
plot_comparison() |
models: list = None, save_path: str = None, show_plot: bool = True |
None |
Plots grouped bar charts comparing Accuracy, Precision, Recall, and F1 Score. Saves image if save_path is given. |
get_summary() |
models: list = None, save_prefix: str = None, show_plot: bool = True |
None |
Executes the full reporting and plotting suite in one call. Auto-exports report CSV and PNG charts if save_prefix is set. |
save_report() |
df_or_filepath: Union[pd.DataFrame, str] = None, filepath: str = None |
None |
Instance method to save report to CSV/Excel/HTML/JSON. Can be called as clf.save_report("report.csv") or clf.save_report(). |
evaluate_model() |
model: estimator, X_test: array = None, y_true: array = None |
tuple |
Evaluates a single trained model instance and returns its evaluation tuple (report, matrix, accuracy, precision, recall, f1, fpr_dict, tpr_dict, roc_auc). |
All model methods accept random_state: int = None and custom hyperparameters (**kwargs):
clf.Logistic_model(random_state=100, max_iter=2000): Trains and evaluates Logistic Regression.clf.Support_vector_model(random_state=99, kernel='rbf'): Trains and evaluates Support Vector Classifier.clf.DecisionTree_model(random_state=42): Trains and evaluates Decision Tree Classifier.clf.KNN_model(n_neighbors=5): Trains and evaluates K-Nearest Neighbors.clf.Naive_Bayes_model(): Trains and evaluates Gaussian Naive Bayes.clf.RandomForest_model(n_estimators=100, random_state=42): Trains and evaluates Random Forest Classifier.clf.GradientBoosting_model(n_estimators=100, random_state=42): Trains and evaluates Gradient Boosting Classifier.clf.AdaBoost_model(n_estimators=50, random_state=42): Trains and evaluates AdaBoost Classifier.
multimodel_analysis.MultiModelRegressor(
    X,
    y,
    test_size=0.3,
    scaled_data=False,
    random_state=42,
    n_jobs=-1
)X(pandas.DataFrame or numpy.ndarray): Feature matrix of shape(n_samples, n_features).y(pandas.Series, pandas.DataFrame, or numpy.ndarray): Continuous target values (automatically flattened if 2D single-column input).test_size(float, default=0.3): Proportion of dataset for test split.scaled_data(bool, default=False): AppliesStandardScalerto features retaining DataFrame structure.random_state(int or None, default=42): Seed for reproducible train-test split.n_jobs(int or None, default=-1): Number of CPU threads for parallel regressors.
| Method | Parameters | Return Type | Description |
|---|---|---|---|
run_all_models() |
custom_models: dict = None, random_state: int = None |
list of tuple |
Fits all 8 built-in regressors (plus optional custom regressors in custom_models). Returns a list of evaluation tuples. |
show_tabular_report() |
models: list = None, return_df: bool = False |
pandas.DataFrame or None |
Displays a formatted comparison table sorted by R² Score (MAE, MSE, RMSE, R²) and recommends the best model. |
plot_true_vs_predicted() |
models: list = None, save_path: str = None, show_plot: bool = True |
None |
Renders True vs Predicted scatter plots with identity line bounds. Saves image if save_path is given. |
plot_comparison() |
models: list = None, save_path: str = None, show_plot: bool = True |
None |
Renders a comparative bar chart of R² Scores across evaluated regressor models. Saves image if save_path is given. |
get_summary() |
models: list = None, save_prefix: str = None, show_plot: bool = True |
None |
Executes full tabular report and plotting pipeline. Auto-exports report CSV and PNG charts if save_prefix is set. |
save_report() |
df_or_filepath: Union[pd.DataFrame, str] = None, filepath: str = None |
None |
Instance method to save report to CSV/Excel/HTML/JSON. Can be called as reg.save_report("report.csv") or reg.save_report(). |
evaluate_model() |
model: estimator, X_test: array = None, y_true: array = None |
tuple |
Evaluates a single trained regressor and returns (mae, mse, rmse, r2, y_pred). |
All model methods accept random_state: int = None and custom hyperparameters (**kwargs):
reg.LinearRegression_model(): Trains and evaluates Linear Regression.reg.Lasso_model(alpha=0.05, random_state=42): Trains and evaluates Lasso Regression.reg.Ridge_model(alpha=1.0, random_state=42): Trains and evaluates Ridge Regression.reg.SVR_model(kernel='rbf'): Trains and evaluates Support Vector Regressor.reg.DecisionTree_model(random_state=42): Trains and evaluates Decision Tree Regressor.reg.RandomForest_model(n_estimators=100, random_state=42): Trains and evaluates Random Forest Regressor.reg.GradientBoosting_model(n_estimators=100, random_state=42): Trains and evaluates Gradient Boosting Regressor.reg.AdaBoost_model(n_estimators=50, random_state=42): Trains and evaluates AdaBoost Regressor.
MultiModelRegressior: Backward-compatibility alias forMultiModelRegressor.
For complete code signatures, detailed parameter options, and copy-pasteable runnable code snippets for every function and method, refer to the func_code.md guide included in this repository.
-
Accuracy:
$\frac{TP + TN}{TP + TN + FP + FN}$ -
Precision (Weighted):
$\sum_{c} w_c \cdot \frac{TP_c}{TP_c + FP_c}$ -
Recall (Weighted):
$\sum_{c} w_c \cdot \frac{TP_c}{TP_c + FN_c}$ -
F1 Score (Weighted):
$2 \cdot \frac{\text{Precision} \cdot \text{Recall}}{\text{Precision} + \text{Recall}}$ -
ROC-AUC: Computed using positive-class probabilities for binary tasks and One-vs-Rest (
ovr) weighted macro-strategy for multiclass tasks.
-
Mean Absolute Error (MAE):
$\frac{1}{n} \sum_{i=1}^n |y_i - \hat{y}_i|$ -
Mean Squared Error (MSE):
$\frac{1}{n} \sum_{i=1}^n (y_i - \hat{y}_i)^2$ -
Root Mean Squared Error (RMSE):
$\sqrt{\frac{1}{n} \sum_{i=1}^n (y_i - \hat{y}_i)^2}$ -
Coefficient of Determination (
$R^2$ ): $1 - \frac{\sum_{i=1}^n (y_i - \hat{y}i)^2}{\sum{i=1}^n (y_i - \bar{y})^2}$
python >= 3.8numpypandasmatplotlibseabornscikit-learn
This project is licensed under the Apache Software License 2.0.
Author: Uditya Narayan Tiwari
Repository: https://github.com/udityamerit/Multimodel-Analysis-Pacakge
PyPI Package: https://pypi.org/project/multimodel-analysis/