Add tag label for adding identifier to plot#2405
Conversation


|
Thomas, thanks for spearheading this. I see label positioning similar to legend positioning: There could be a position option in the theme that can either be a string such as |

|
What if the label is longer? Does it overlap with the plot area, or does the margin expand? |
|
Hadley, My personal opinion is that labels should generally be pasted onto the plot without expanding any margins. That almost always produces the best visual results. However, the API I proposed, which follows the Best, |

|
I just had a similar discussion with @baptiste on twitter where I ended up proposing something similar to @clauswilke. My personal feeling is that the default should never allow overlapping of plot elements |
|
I’ll update this pr to include a more flexible positioning and we can take it from there |

|
oops sorry was on my phone and limited to twitter. I agree with the general consensus; my personal view is that
|
|
I've added a If you want a tight fit then provide coordinates, if you want automatic expansion to make room, use a string. ggplot(mtcars) +
geom_point(aes(disp, mpg)) +
labs(tag = 'A', title = 'test') +
theme(plot.tag.position = "topleft") # Default
compared to using coordinates ggplot(mtcars) +
geom_point(aes(disp, mpg)) +
labs(tag = 'A', title = 'test') +
theme(plot.tag.position = c(0, 1))
|


|
Does the current implementation/features satisfy all parties? |
|
Looks good to me but I don't have a computer with me. I'd suggest
eyeballing many visual test cases, with different themes and font sizes
(24pt theme) as it's usually where things go wrong with overlap etc.
…On 20/01/2018 05:59, "Thomas Lin Pedersen" ***@***.***> wrote:
Does the current implementation/features satisfy all parties?
—
You are receiving this because you were mentioned.
Reply to this email directly, view it on GitHub
<#2405 (comment)>,
or mute the thread
<https://github.com/notifications/unsubscribe-auth/AABKGpu5VMbk1eGdgRXjAZ0pj63RGRN0ks5tMMnagaJpZM4Rh3Oz>
.
|
|
I think this is all fine. Do I understand correctly that this code should produce a tag that is left-aligned with the y axis title? |

|
The only thing I'm wondering about is tag length. As was mentioned on Twitter (and above), these things should be short. Are you going to restrict their length at all? I didn't see anything in the pull (may have missed it?). |
|
I've played around with the code a bit, and I can't say that I find the behavior of
(The same is seen for
My expectation would be that |


|
Yeah, I’ve stumbled onto that as well - I think the grob needs to be wrapped inside another gtree but I won’t get to it before monday |
|
@bhive01 I have no intention of limiting the number of characters in the tag - I cannot see any compelling reason to put an arbitrary limit on it... @clauswilke I've played around with making justification work along with margins to no avail - I'll try some more but there're some grid interplay that complicates it... |
|
@clauswilke I have fixed the margin/justification interplay so that it now works as I would expect - can you test and see if it is sensible to you..? |
|
@hadley do you think this PR will get merged into the next release (if up to standard)? It's a rather fundamental addition in the 11th hour, but |
|
Yes - I now thing implementing tidy evaluation isn't going to be that hard, so I'm going to hold off the release until that's in. |
|
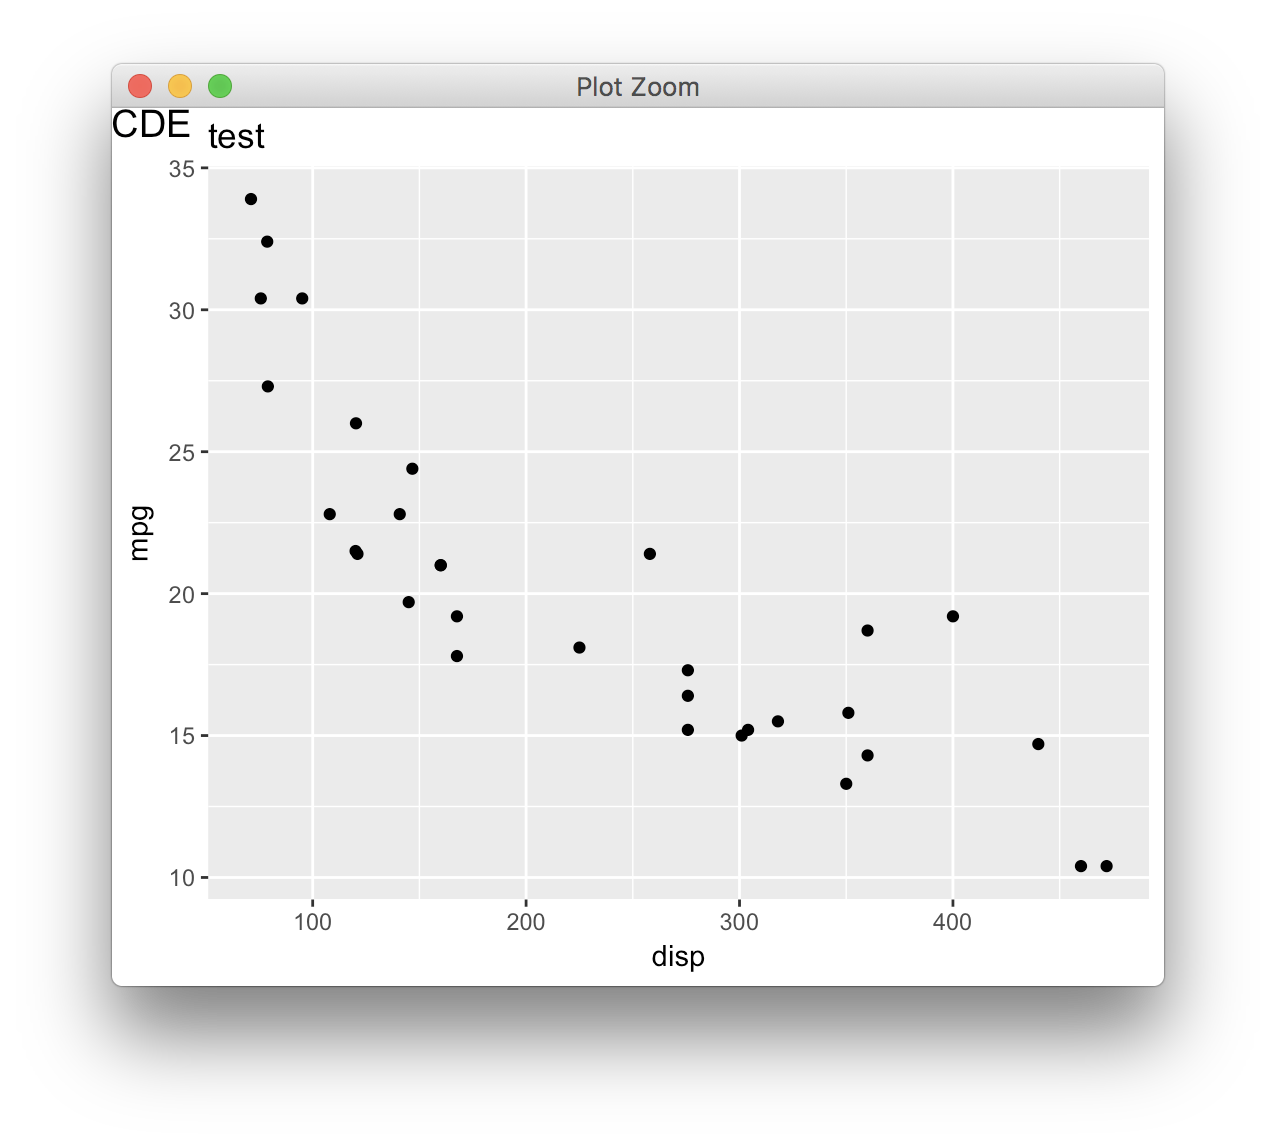
I took a look at it. I think it's mostly working as expected but there's one remaining issue. The coordinate system doesn't seem to cover the entire plot area but instead the area minus the margin. I think this results in somewhat unintuitive behavior. First, with a tag position of p <- ggplot(mtcars) +
geom_point(aes(disp, mpg)) +
labs(tag = 'A', title = 'test') +
theme(plot.tag.position = c(0, 1))
p + theme(plot.tag = element_text(hjust = 0, vjust = 1))
p + theme(plot.tag = element_text(hjust = 0.5, vjust = 0.5))
p + theme(plot.tag = element_text(hjust = 1, vjust = 0))
Second, while the middle result (with ggplot(mtcars) +
geom_point(aes(disp, mpg)) +
labs(tag = 'ABCDE', title = 'test') +
theme(plot.tag.position = c(0, 1),
plot.tag = element_text(hjust = 0.5, vjust = 0.5)
I'd rather be able to actually use the true top left corner of the plot as reference point and use the margins of the |


|
Omitting the margin was intentional, but an easy change. The philosophy being that the margin is an actual empty space around the plot and if you want plot elements to extend to the edge you set the margin to zero. I’m not going to be a user of freely positioned tags so I can be convinced to change it by a majority vote - what are the thoughts of @hadley, @baptiste, and @bhive01? |
|
I thought about it some more. I think it's fine as is. Placing the tag with |
|
I'm with @clauswilke on this. I finally got a chance to play with it (thanks dev_mode()!) and I understand what the position parts mean. All of the pieces including position and hjust/njust work how I expect so I'm 👍. Good inclusion for the needed multi-plot labeling problem. |
|
Returning to a computer and playing with this last night I realised I didn't understand the design of titleGrob (namely the interaction of margins and just – I would have shifted the whole label+ margins block). With these existing conventions the tag implementation seems good to me (though there is I believe some slight inconsistency in handling justification between manual position vs added cells that may cause some surprises). I can see why the plot margin might be seen as an extra margin around everything, but on the other hand it could be convenient to have a way to add something (not necessarily a tag) over the entire plot in npc, for instance a watermark/copyright/draft notice, or banners à la fivethirtyeight, etc. Perhaps it'd be best implemented as a separate item such as I'm also still wondering if it could make sense at some stage to let Anyway, this is just a digression. I haven't had a chance to try it but I would still strongly recommend a comprehensive visual test in many configurations (font size, layout) and various themes. I remember being quite surprised at how bad some things looked with a large font size (as used in presentations/posters). |


|
(ignore that milestone, a keyboard cat was involved 😹) |
|
@hadley are you needing anything more for this PR (except time to review it) |
|
Since this hasn't been merged yet, I wanted to propose one very minor modification. I think the default size of the tags should be |
|
I agree, the font sizes are already confusing; I never realised a
(said names are set in 13pt, though the one-column draft preview blew up the whole figure). |
|
Thanks Lionel. I’ll look into where I’ve inadvertently passed a null to a grid call |
|
That was one weird bug grid had back then... 😱 should be fixed now for all versions |
|
Oh, that was the issue. It's the reason why I increased the minimum R version for cowplot to 3.3. Maybe you could add a small comment explaining why the code is written this way? E.g., "avoid assigning into unit vectors for compatibility with R <= 3.2." |
|
Sure - that's a good idea |
|
If it's a new feature of grid, it's a shame to write code that is less transparent just to work around it for earlier versions of R, which in the future will be less and less relevant. |
|
I'll let such infrastructure decisions be up to @hadley - I don't personally think the new code is much less transparent as to warrant such measures... |

|
@thomasp85 if you rebase on master the appveyor build should now be fixed, just in case you'd like to have that sweet green checkmark ;) |

…f widths and heights
|
@thomasp85 Do you want to use |
|
Already implemented in 12646f8 |
|
@lionel- it seems AppVeyor and vdiffr are still acting up despite a rebase... |
|
@thomasp85 you should now use |
|
gotcha |


|
This old issue has been automatically locked. If you believe you have found a related problem, please file a new issue (with reprex) and link to this issue. https://reprex.tidyverse.org/ |

7 participants


As per discussions on twitter, this PR adds a
taglabel alongsidetitle,subtitle, andcaption. It is placed in the upper left corner in its own row and column between the margin and the title/x-label.The tag name is chosen over
labelas thelabs()function indicate that “label” is a catchall term for all types of titles.The default theming is like this:
The size is slightly larger than the title and the margin is chosen so that it is well separated from the main parts of the plot. In general this is based on my own taste and is up for discussion.