I want to print a couple of ggplots in a group_walk loop. But one of the plots only returns values in one bin which resolves in an error.
Here is an example:
library(ggplot2)

data.frame(x = c("a", "b"),
           y = c("A", "B")) |>
  ggplot() +
  geom_bin_2d(aes(x = x, y = y)) +
  scale_fill_binned()
#> Error in cut.default(x, breaks, labels = FALSE, include.lowest = TRUE, : invalid number of intervals
Created on 2022-11-29 with reprex v2.0.2
If there is a bin with a at least two different numbers (here 1 and 2), the plot succeeds:
library(ggplot2)

data.frame(x = c("a", "b", "b"),
           y = c("A", "B", "B")) |>
  ggplot() +
  geom_bin_2d(aes(x = x, y = y)) +
  scale_fill_binned()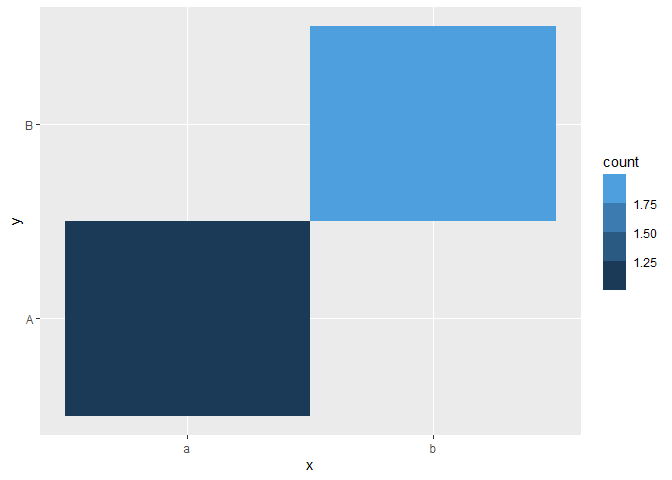
Created on 2022-11-29 with reprex v2.0.2
If I remove the scale_fill_binned() part the chart is drawn, but with no color steps. Similar (but different) error is thrown if I use guides(fill = "colorsteps"). Using geom_tile(aes(x, y, fill = after_stat(count)), stat = "bin2d") shows the same behaviour.
ggplot version is 3.4.0.
Regards
SebNeu
I want to print a couple of ggplots in a group_walk loop. But one of the plots only returns values in one bin which resolves in an error.
Here is an example:
Created on 2022-11-29 with reprex v2.0.2
If there is a bin with a at least two different numbers (here 1 and 2), the plot succeeds:
Created on 2022-11-29 with reprex v2.0.2
If I remove the
scale_fill_binned()part the chart is drawn, but with no color steps. Similar (but different) error is thrown if I useguides(fill = "colorsteps"). Usinggeom_tile(aes(x, y, fill = after_stat(count)), stat = "bin2d")shows the same behaviour.ggplot version is 3.4.0.
Regards
SebNeu