Density/count data is correctly plotted with geom_bin_2d() or with manual counts via geom_raster(), but colors representing the counts are regularly off in geom_hex().
It was working in a previous version (I apologize as I'm not sure exactly which version but around 2022-08-01)
Previous example, working as intended:

Reprex below - note the color difference in the hex - not quite reversed, but regularly wrong.
library(tidyverse)
library(patchwork)

souce_url <- "https://raw.githubusercontent.com/ArrowheadAnalytics/next-gen-scrapy-2.0/master/pass_and_game_data.csv"

pass_map_df <- read_csv(souce_url) %>%
  na.omit()

manual_raster <- pass_map_df |>
  select(x, y) |>
  mutate(x = round(x),
         y = round(y)) |>
  group_by(x,y) |>
  count() |>
  ggplot(aes(x =x, y = y, fill = n)) +
  geom_raster() +
  scale_fill_gradient(low = "red", high = "yellow") +
  geom_hline(yintercept = c(2, 7), color = "grey") +
  scale_y_continuous(breaks = seq(-10, 60, 5)) +
  labs(title = "Manual calc raster")

bin2d <- pass_map_df %>%
  ggplot(aes(x = x, y = y)) +
  geom_bin_2d(
    binwidth = c(1, 1)
  ) +
  scale_fill_gradient(low = "red", high = "yellow") +
  geom_hline(yintercept = c(2, 7), color = "grey") +
  scale_y_continuous(breaks = seq(-10, 60, 5)) +
  labs(title = "Using bin2d")


hex_plot <- pass_map_df %>%
  ggplot(aes(x = x, y = y)) +
  geom_hex(
    binwidth = c(1, 1)
  ) +
  scale_fill_gradient(low = "red", high = "yellow") +
  geom_hline(yintercept = c(2, 7), color = "grey") +
  scale_y_continuous(breaks = seq(-10, 60, 5))

bin2d + manual_raster + hex_plot +
  plot_layout(ncol = 2, nrow = 2, heights = 1)+
  labs(title = "Using geom_hex")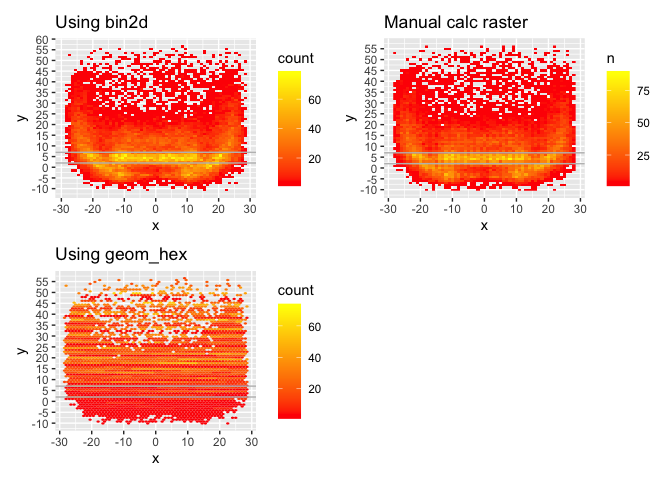
Created on 2022-11-10 by the reprex package (v2.0.1)
Session Info
─ Session info ───────────────────────────────────────────────────────────────
 setting  value
 version  R version 4.2.0 (2022-04-22)
 os       macOS Monterey 12.6
 system   aarch64, darwin20
 ui       X11
 language (EN)
 collate  en_US.UTF-8
 ctype    en_US.UTF-8
 tz       America/Chicago
 date     2022-11-10
 pandoc   2.19.2 @ /Applications/RStudio.app/Contents/Resources/app/quarto/bin/tools/ (via rmarkdown)
 quarto   1.2.242 @ /usr/local/bin/quarto

─ Packages ───────────────────────────────────────────────────────────────────
 package     * version    date (UTC) lib source
 dplyr       * 1.0.10     2022-09-01 [1] CRAN (R 4.2.0)
 forcats     * 0.5.1      2021-01-27 [1] CRAN (R 4.2.0)
 ggExtra     * 0.10.0     2022-03-23 [1] CRAN (R 4.2.0)
 ggplot2     * 3.4.0      2022-11-04 [1] CRAN (R 4.2.0)
 ggridges    * 0.5.3      2021-01-08 [1] CRAN (R 4.2.0)
 ggtext      * 0.1.1      2022-09-14 [1] Github (wilkelab/ggtext@50fdaba)
 lubridate   * 1.8.0      2021-10-07 [1] CRAN (R 4.2.0)
 paletteer   * 1.5.0      2022-10-19 [1] CRAN (R 4.2.0)
 patchwork   * 1.1.0.9000 2022-04-26 [1] Github (thomasp85/patchwork@79223d3)
 purrr       * 0.3.5      2022-10-06 [1] CRAN (R 4.2.0)
 readr       * 2.1.3      2022-10-01 [1] CRAN (R 4.2.0)
 scales      * 1.2.1      2022-08-20 [1] CRAN (R 4.2.0)
 sessioninfo * 1.2.2      2021-12-06 [1] CRAN (R 4.2.0)
 stringr     * 1.4.1      2022-08-20 [1] CRAN (R 4.2.0)
 tibble      * 3.1.8      2022-07-22 [1] CRAN (R 4.2.0)
 tidyr       * 1.2.1      2022-09-08 [1] CRAN (R 4.2.0)
 tidyverse   * 1.3.2.9000 2022-08-16 [1] Github (tidyverse/tidyverse@3be8283)

 [1] /Library/Frameworks/R.framework/Versions/4.2-arm64/Resources/library
Density/count data is correctly plotted with
geom_bin_2d()or with manual counts viageom_raster(), but colors representing the counts are regularly off ingeom_hex().It was working in a previous version (I apologize as I'm not sure exactly which version but around 2022-08-01)
Previous example, working as intended:
Reprex below - note the color difference in the
hex- not quite reversed, but regularly wrong.Created on 2022-11-10 by the reprex package (v2.0.1)
Session Info