Legend for geom_col()'s size does not correctly depict change in size #4852
Description
I'm not sure if this is related to issue #3729 at all, but here it is: when using the size aesthetic for a bar/col geometry, the corresponding legend does not match differences in sizes in the plot like e.g. a point geometry would. This is especially true if the colour aesthetic is also mapped to a variable from the dataset, as the outline completely disappears from the legend and therefore the audience might think that it's the darker area that depicts the size:
library(ggplot2)
# coloured outline (continuous)
exp_df <- data.frame(x = letters[1:4], y = 1:4)
ggplot(exp_df, aes(x, y, size = y, colour = y)) +
  geom_col()
# coloured outline (discrete)
ggplot(exp_df, aes(x, y, size = y, colour = x)) +
  geom_col()
# transparent fill
ggplot(exp_df, aes(x, y, size = y, colour = y)) +
  geom_col(alpha = 0)
# single colour
ggplot(exp_df, aes(x, y, size = y)) +
  geom_col(colour = "red", alpha = 0)
Created on 2022-05-18 by the reprex package (v2.0.1)
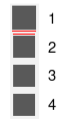
There is a very slight different in size (2 pixels) between the first square and the three others in the legend, but that's it: