This is a bit of a weird corner case I think, but I've found (on CRAN and on the github version as of today) that setting size = NA on several geoms causes guide generation to fail and therefore the plot to fail to generate.
I'll use this data:
df = data.frame(
x = c(1, 2),
group = c("a","b")
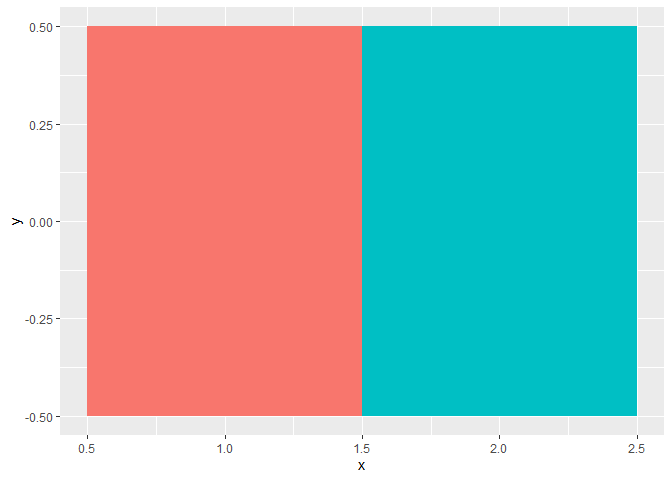
)First, a reprex with geom_tile() (the fill mapping is needed so that a guide is generated):
library(ggplot2)
df = data.frame(
  x = c(1, 2),
  group = c("a","b")
)
ggplot(df, aes(y = 0, x = x, width = 1, height = 1, fill = group)) +
  geom_tile(size = NA)
#> Error in grid.Call.graphics(C_setviewport, vp, TRUE): non-finite location and/or size for viewport
Created on 2021-07-20 by the reprex package (v2.0.0)
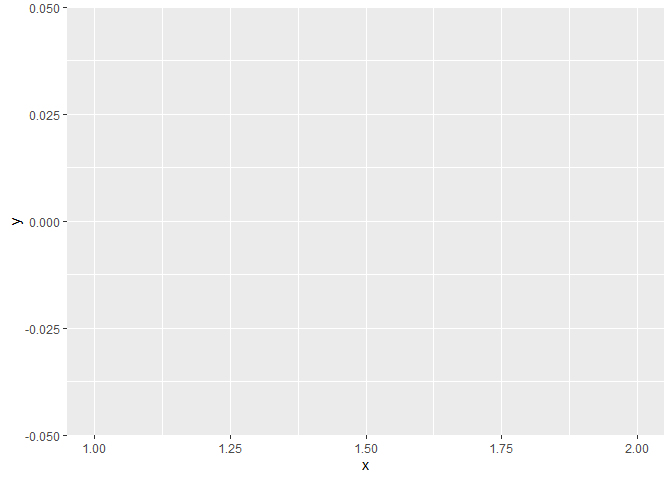
I would expect behavior more like setting color = NA; i.e. geoms (or outlines of geoms) would not be drawn but the plot would still generate. I've tracked this down to somewhere in the guide generation code. If you turn the legend off, you get a plot:
ggplot(df, aes(y = 0, x = x, width = 1, height = 1, fill = group)) +
  geom_tile(size = NA, show.legend = FALSE)
Which is what I would expect. Similar problems occur in other geoms; e.g. geom_point():
ggplot(df, aes(y = 0, x = x, color = group)) +
  geom_point(size = NA)
#> Warning: Removed 2 rows containing missing values (geom_point).
#> Error in grid.Call.graphics(C_setviewport, vp, TRUE): non-finite location and/or size for viewport
Here the warning is expected, but I think the error is not --- I would have expected output like what happens if you set color = NA; i.e. a blank plot:
ggplot(df, aes(y = 0, x = x, color = group)) +
  geom_point(color = NA)
#> Warning: Removed 2 rows containing missing values (geom_point).
I believe the problem may be related to this line:
|
key_size_mat <- do.call("cbind", lapply(guide$geoms, function(g) g$data$size / 10)) |
As when size = NA this will result in key_size_mat being all NAs, and then key widths and heights downstream end up all NAs. However I don't know enough about the surrounding code/context to suggest an appropriate solution.
Thanks!
This is a bit of a weird corner case I think, but I've found (on CRAN and on the github version as of today) that setting
size = NAon several geoms causes guide generation to fail and therefore the plot to fail to generate.I'll use this data:
First, a reprex with
geom_tile()(thefillmapping is needed so that a guide is generated):Created on 2021-07-20 by the reprex package (v2.0.0)
I would expect behavior more like setting
color = NA; i.e. geoms (or outlines of geoms) would not be drawn but the plot would still generate. I've tracked this down to somewhere in the guide generation code. If you turn the legend off, you get a plot:Which is what I would expect. Similar problems occur in other geoms; e.g.
geom_point():Here the warning is expected, but I think the error is not --- I would have expected output like what happens if you set
color = NA; i.e. a blank plot:I believe the problem may be related to this line:
ggplot2/R/guide-legend.r
Line 385 in 13c0730
As when
size = NAthis will result inkey_size_matbeing allNAs, and then key widths and heights downstream end up allNAs. However I don't know enough about the surrounding code/context to suggest an appropriate solution.Thanks!