Hello there,
This is just a minor inconsistency, but in case this wasn't noticed yet, here it is. Apparently, guide_colourbar() uses the ticks.linewidth and frame.linewidth parameter as-is, while in the rest of ggplot2 (as far as I can tell), almost every parameter for linewidth is calculated as below:
# Right before handing `supplied_value` to grid
lwd = supplied_value * .pt
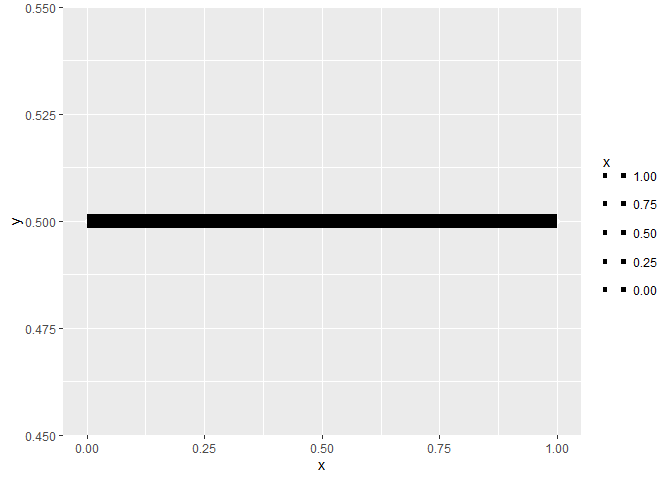
Here is a reprex with exaggerated line sizes. You can notice when comparing the width of geom_line() versus the colourbar guide ticks. The lines appear of the same width when you adjust ticks.linewidth = 5 * .pt.
library(ggplot2)

df <- data.frame(x = c(0, 1), y = c(0.5, 0.5))

ggplot(df, aes(x, y)) +
  geom_point(aes(colour = x)) +
  geom_line(size = 5) +
  scale_colour_gradientn(
    colours = c("white", "white"),
    guide = guide_colourbar(ticks.colour = "black", ticks.linewidth = 5)
  )
Created on 2021-01-12 by the reprex package (v0.3.0)
Thanks for reading!
Hello there,
This is just a minor inconsistency, but in case this wasn't noticed yet, here it is. Apparently,
guide_colourbar()uses theticks.linewidthandframe.linewidthparameter as-is, while in the rest of ggplot2 (as far as I can tell), almost every parameter for linewidth is calculated as below:Here is a reprex with exaggerated line sizes. You can notice when comparing the width of
geom_line()versus the colourbar guide ticks. The lines appear of the same width when you adjustticks.linewidth = 5 * .pt.Created on 2021-01-12 by the reprex package (v0.3.0)
Thanks for reading!