A Colorado Board of Elections were being held and underway! We were tasked with completing an election audit for the local congressional election. The overall goal is to outline how the eleciton results were and to outline the following tasks:
- Calculate the total number of votes cast.
- Get a complete list of candidates who received votes.
- Calculate the total number of votes each candidate won.
- Calculate the percentage of votes each candidate won.
- Determine the winner of the election based on popular vote.
- Data Source: election_results.csv
- Software: Python 3.10.5, Visual Code, 1.38.1
The analysis of the eleciton show that:
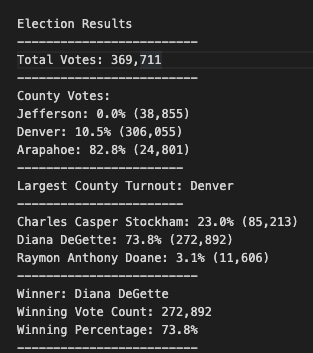
- Overall, there were 369,711 total votes in this congressional election.
- The folllowing counties and their percentage of total votes were:
- Jefferson with 10.5% of total votes and 38,855 number of votes.
- Denver with 82.8% of total votes and 306,055 number of votes.
- Arapahoe with 6.7% of total votes and 24,801 number of votes.
- Denver had the largest number of votes.
- The candidates were:
- Charles Casper Stockham
- Diana DeGette
- Raymon Anthony Doane
- The candidate results were:
- Charles Casper Stockham received 23.0% of the vote and 85,213 number of votes.
- Diana DeGette received 73.8% of the vote and 272,892 number of votes.
- Raymon Anthony Doane received 3.1% of the vote and 11,606 number of votes.
- The winner of the election was:
- Diana DeGette, who received the winning percentage of 73.8% of the vote and 272,892 number of total votes. Diana DeGette was the winner of the overall election.
Below is the overall results:
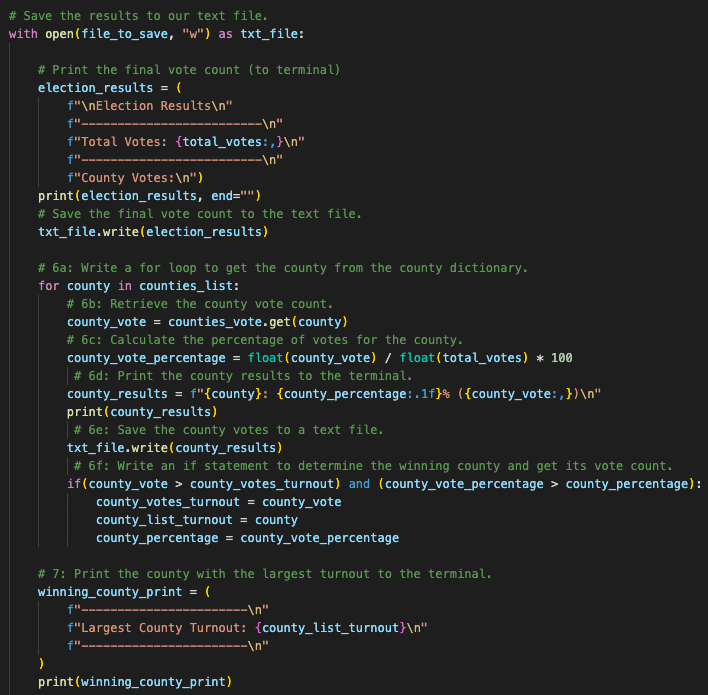
Below is the code used to run analysis for County Votes and Largest County:
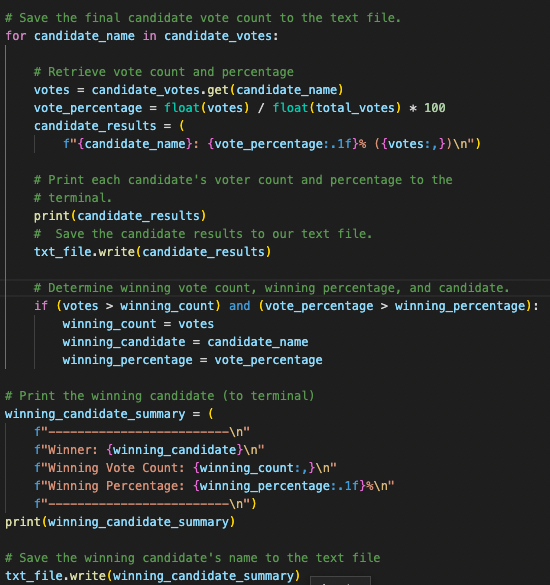
Below is the code used to run analysis for Winning Candidate and candidate percentages:
After reviewing the results from the election, one can conclude that using Python to outline and audit election results was a great decision! Running the details of any election through this system would gain the election commission futher needs to focus on other marketing for an eleciton instead of worrying about how the votes will be analyzed. There are a couple different ways in which this script written in Python can be modified to be used for other elections:
- Update the "Largest County Turnout" to show the "Least County Turnout". That way, the election commission would be able to determine how they can market to have the county produce more votes.
- Add in the "Cty" within the election. This would be beneficial, in case the election commission wanted to pass this script on to a state-wide count.