> A microservices-style stack focused on monitoring and observability.
In modern DevOps, "deploying" is only half the battle. The real challenge lies in Observability: understanding why a system behaves the way it does.
The Sentinel Stack is an advanced microservices architecture that extends a standard web stack (Flask/Redis/Nginx) with a robust Metric Monitoring Layer. It focuses on Metric-based Observability by utilizing Prometheus for scraping time-series data and Grafana for high-fidelity visualization. This helps avoid the "black box" problem by exposing metrics like request latency, error rates, and traffic patterns.
The system can be viewed in two parts: request handling and metric collection.
graph TD;
    subgraph "Traffic Plane"
        Client((User)) -->|HTTP:80| Nginx[Nginx Gateway];
        Nginx -->|Proxy Pass| Web[Flask App];
        Web <-->|Read/Write| Redis[(Redis DB)];
    end

    subgraph "Observability Plane"
        Prometheus[Prometheus Server] -- Scrape /metrics --> Web;
        Grafana[Grafana Dashboard] -- Query Data --> Prometheus;
    end
- Ingress: Requests hit Nginx (Reverse Proxy).
- Processing: Flask handles logic and exposes system metrics at
/metrics. - Persistence: Redis maintains stateful data (visitor counts).
- Collection: Prometheus scrapes metrics from Flask every 5 seconds.
- Visualization: Grafana queries Prometheus to display real-time dashboards.
(This dashboard visualizes Request Rate, Error Rate, and Latency in real-time)
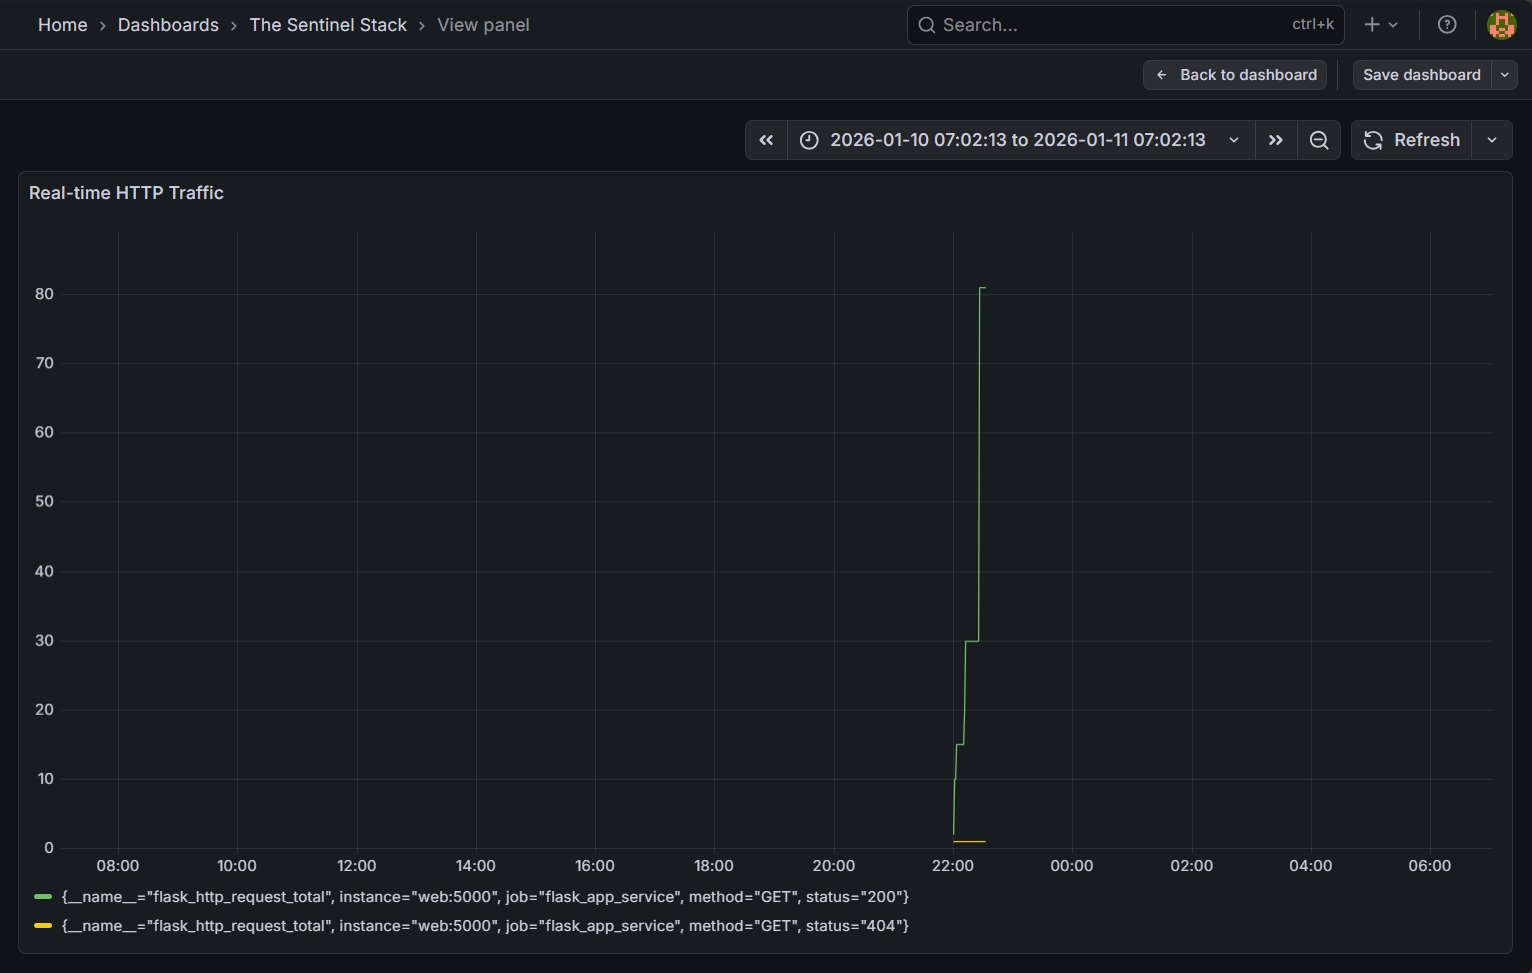
Note: The dashboard above tracks HTTP Status Codes, Response Times, and Redis Connectivity.
- Real-time Monitoring: Automatically tracks application performance, including Request Per Second (RPS) and 95th Percentile Latency.
- Metric-Driven Insights: Exposes metrics that make performance issues easier to spot.
- Containerized Ecosystem: The entire stack, including the monitoring infrastructure, is defined as code (
docker-compose.yml) for reproducible deployments. - Alerting Ready: Structure is prepared for setting up Prometheus Alertmanager rules (e.g., trigger alert if Error Rate > 5%).
| Component | Role | Technology |
|---|---|---|
| Orchestrator | Infrastructure Management | Docker Compose |
| Gateway | Reverse Proxy & Load Balancing | Nginx (Alpine) |
| Backend | Application Logic & Metric Exporter | Python Flask |
| Database | Key-Value Store | Redis |
| Collector | Time-Series Database & Scraping | Prometheus |
| Visualizer | Analytics & Dashboarding | Grafana |
Ensure you have Docker and Docker Compose installed on your machine.
Clone the repository and spin up the containers:
git clone https://github.com/swnst/the-sentinel-stack.git
cd the-sentinel-stack
docker-compose up -d --buildCheck if all containers are healthy:
docker-compose ps| Service | URL | Credentials (Default) |
|---|---|---|
| Web App | http://localhost:80 |
N/A |
| Prometheus | http://localhost:9090 |
N/A |
| Grafana | http://localhost:3000 |
User: admin / Pass: admin |
.
├── app.py               # Flask App with Prometheus Exporter initialized
├── docker-compose.yml   # Full stack definition (5 Services)
├── Dockerfile           # Python application container spec
├── nginx.conf           # Reverse proxy configuration
├── prometheus.yml       # Prometheus scraping rules
├── requirements.txt     # Python dependencies
└── README.md            # Documentation