IBMMA is a powerful and versatile free software package designed for meta- and mega-analysis on neuroimaging datasets aggregated from multiple study sites, such as ENIGMA (Enhancing NeuroImaging Genetics through Meta Analysis) Consortium and NCANDA (National Consortium on Alcohol and Neurodevelopment in Adolescence). It employs mass-univariate statistical models to analyze diverse neuroimaging features, including voxel-, vertex-, and connectome-based anatomical and functional brain measures.
IBMMA harnesses the power of parallel processing by leveraging multi-CPU capabilities available in modern clusters and personal computers. It boasts the remarkable ability to perform statistical analysis on thousands of subjects and millions of neuroimaging features simultaneously, across various platforms such as Linux, Mac, and Windows. This capability is crucial for analyzing big neuroimaging datasets that far exceed the scale of most single cohort studies prevalent in the past two decades.
One of IBMMA's strengths lies in its modeling flexibility. It not only employs widely-used linear models but also incorporates more sophisticated statistical approaches available in released R and Python packages. This versatility enables researchers to tailor their analyses to specific research questions and data characteristics.
IBMMA produces multiple statistical outputs and model estimations that are consistent with the raw data in terms of dimensionality. This consistency ensures that the results are easily visualized and compared across different models, facilitating comprehensive data analysis and interpretation.
In summary, IBMMA is an optimal tool for big neuroimaging data analysis and displaying statistical results. Its powerful capabilities, versatility, and user-friendly output make it an indispensable asset for researchers working with large-scale neuroimaging datasets from multiple study sites.
The current version was mainly developped and tested through using the VSCode(Visual Studio Code) software under Linux platform running on Duke BIAC Cluster. More tests and debugs are needed for different platforms and operating systems. Please download & test the code. Please feel free to contact Dr. Delin Sun at ds366@duke.edu if you meet any problem.
Download or clone the entire package. Configure Python and R according to the requirements below. Set up your data paths and parameters in path_para.xlsx. Run python ibmma.py in the terminal. View summary reports in the Reports subfolder and detailed results in the Results subfolder.
Python Requirements Python==3.11.9 atlasreader==0.3.2 matplotlib==3.10.6 nibabel==5.3.2 nilearn==0.12.1 numpy==2.3.3 pandas==2.3.2 scipy==1.16.1 seaborn==0.13.2 statsmodels==0.14.4 tableone==0.9.5 tqdm==4.66.5
R Requirements R==4.2.2 pacman==0.5.1 pTFCE==0.2.2.1
Neuroimaging studies on large datasets aggregated from multiple sites (or sources) are becoming increasingly popular. Data repositories such as ENIGMA and NCANDA often provide brain data from hundreds or thousands of individuals. Findings from these large neuroimaging datasets are more robust and replicable than results from traditional single-cohort studies, potentially paving the way for uncovering stable biomarkers for clinical diagnosis and intervention. However, advantages also accompany these challenges:
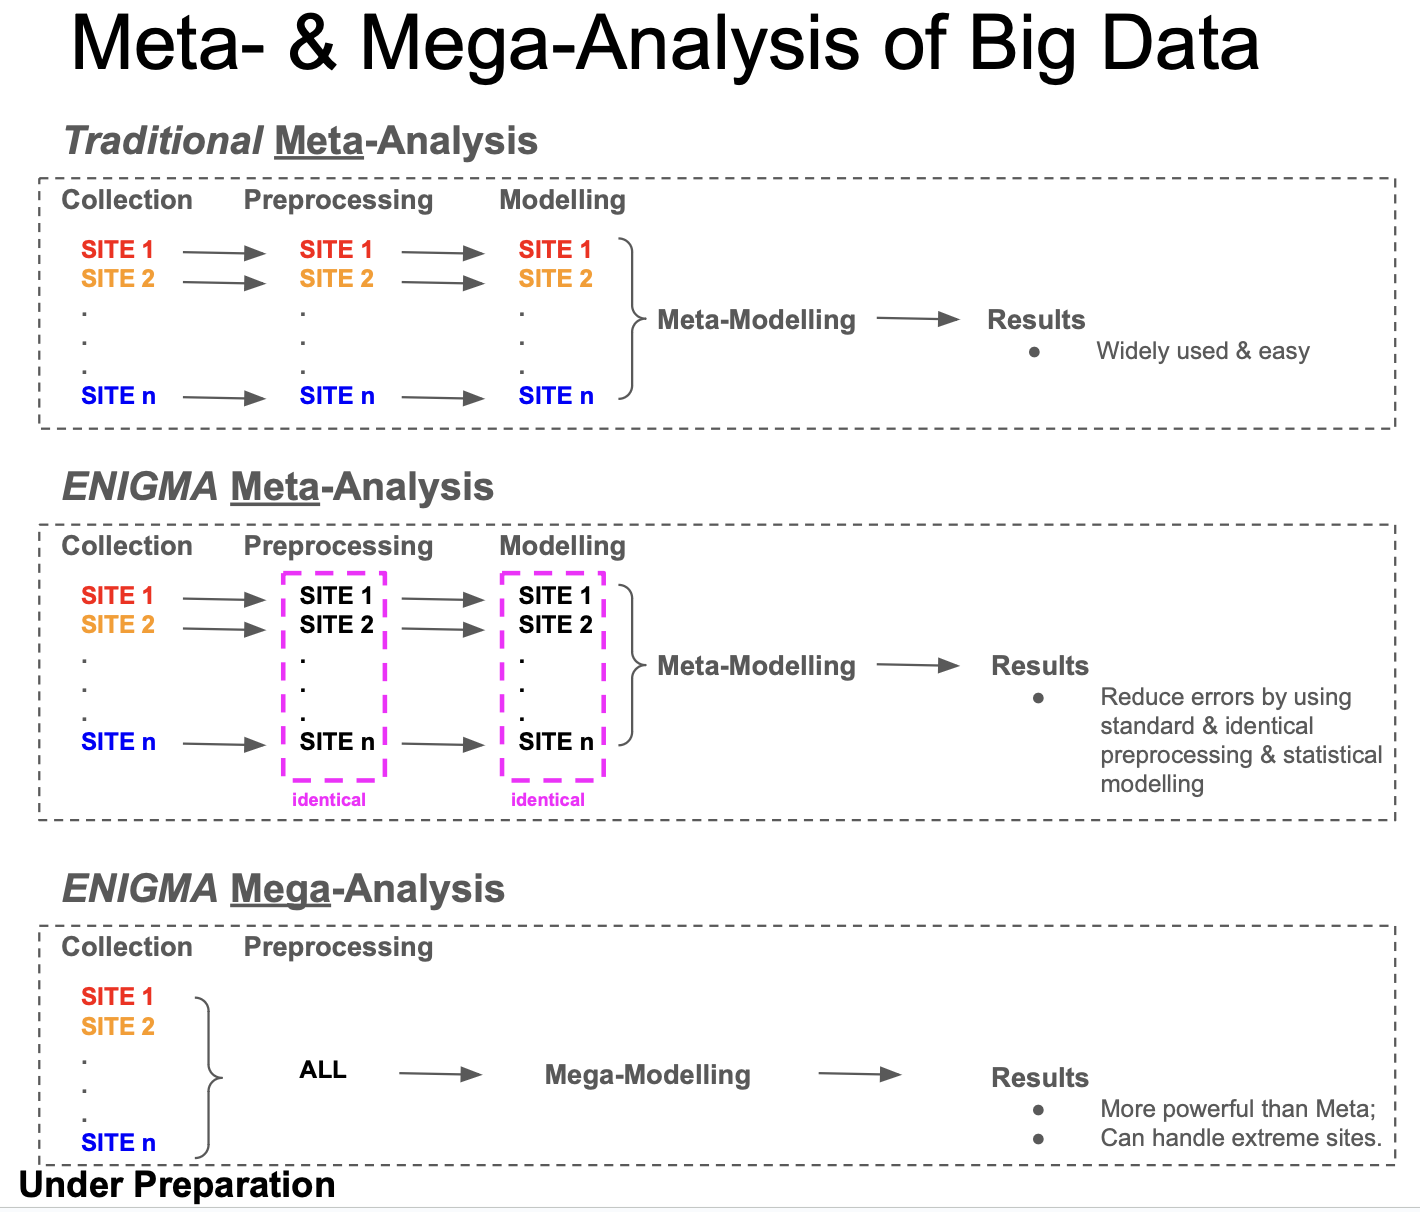
---- Meta-Analysis & Mega-Analysis. Neuroimaging data were acquired using various scanners and diverse scanning protocols. Demographic characteristics (e.g., age, sex, education level, and socioeconomic status) and clinical characteristics (e.g., diagnosis, comorbidity, and substance/medication usage) of the participants varied significantly across studies. IBMMA employs meta- and mega-analysis to examine the effects of interest while removing or controlling for the effects of study sites.
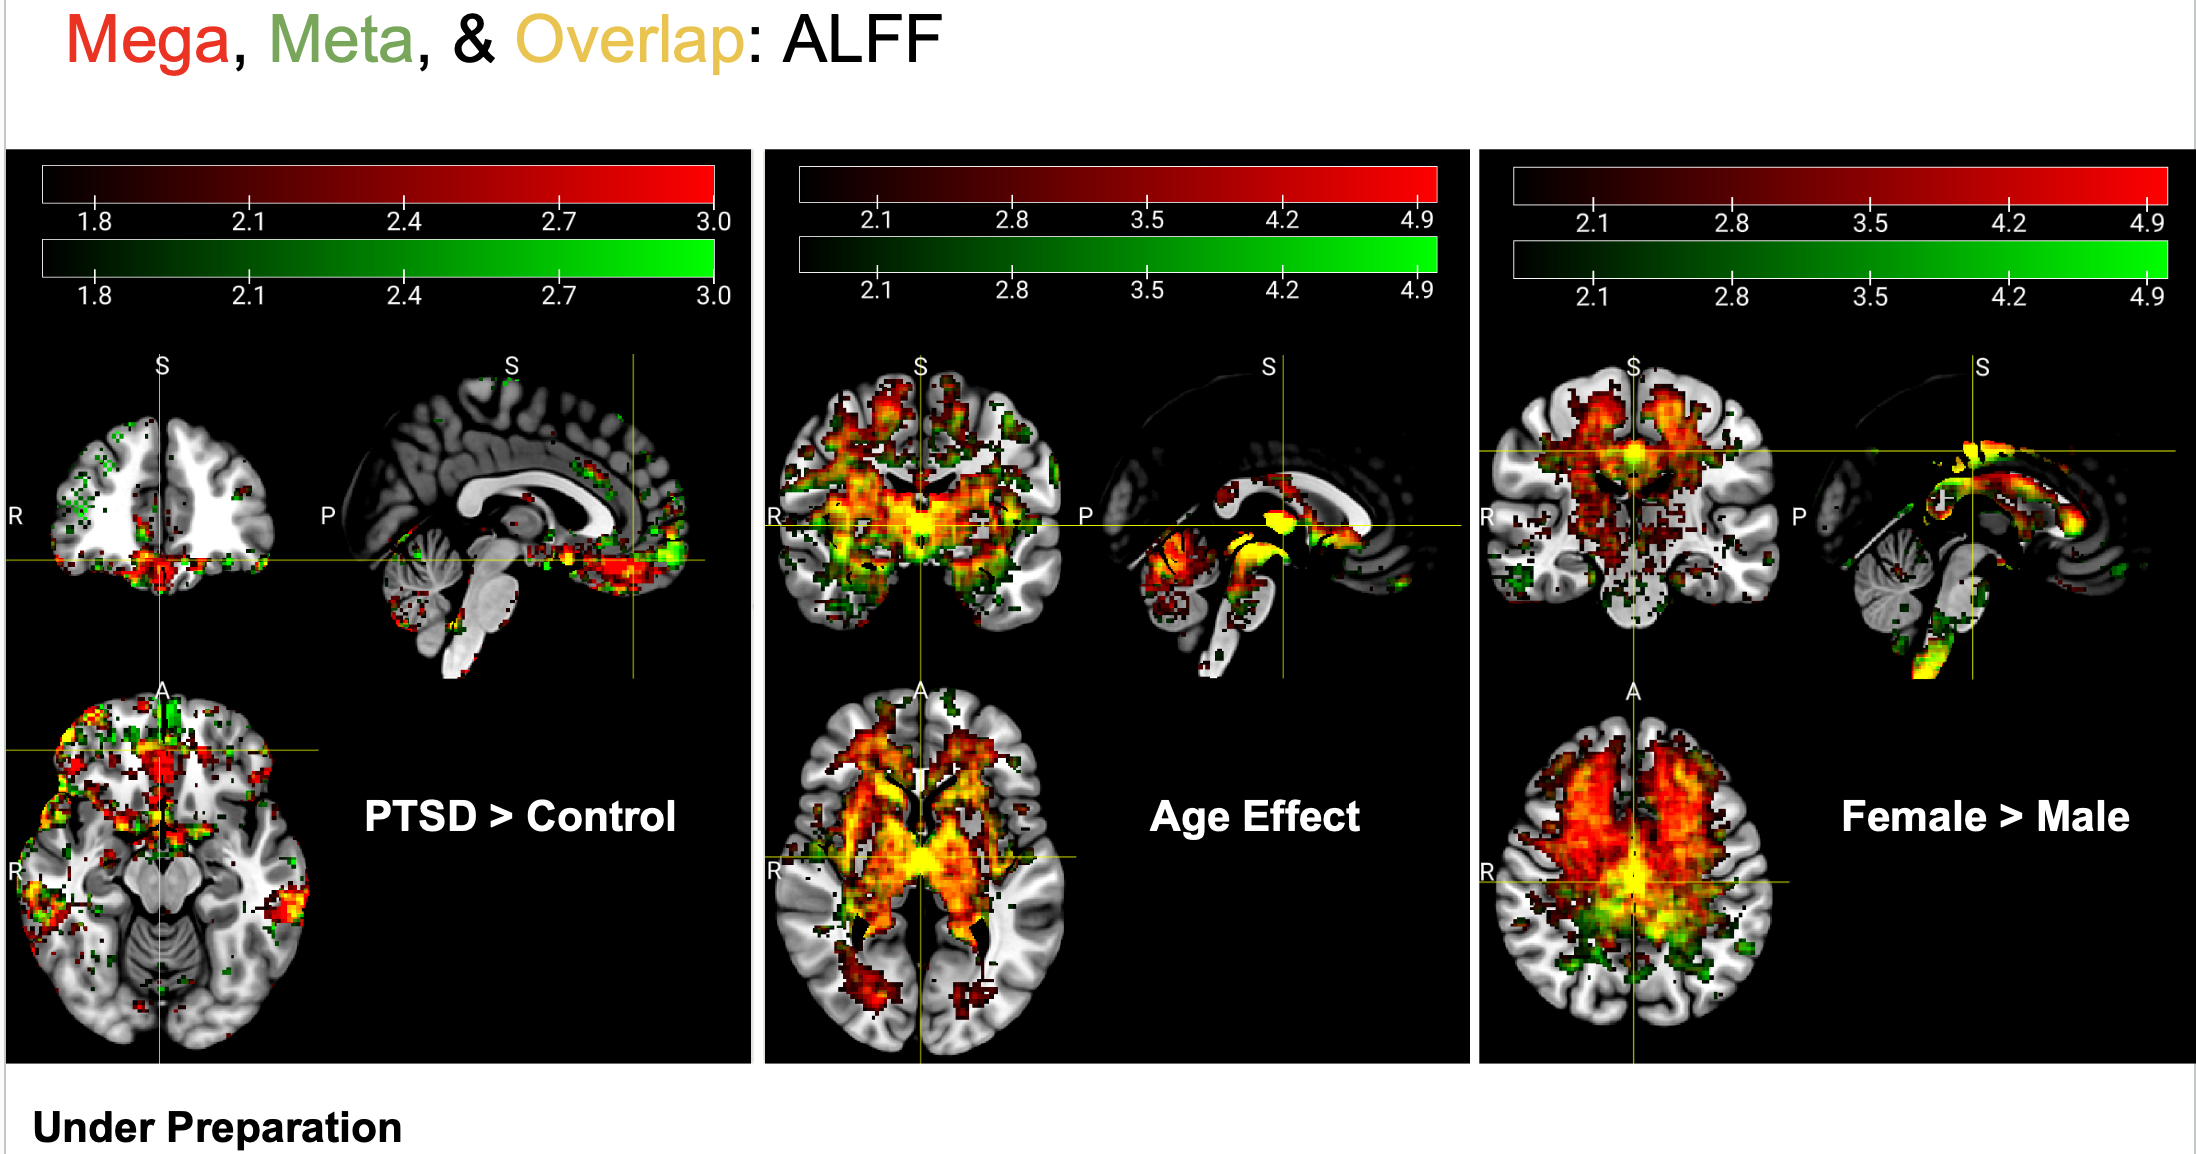
We can get robust and beautiful Meta- and Mega-analysis results:
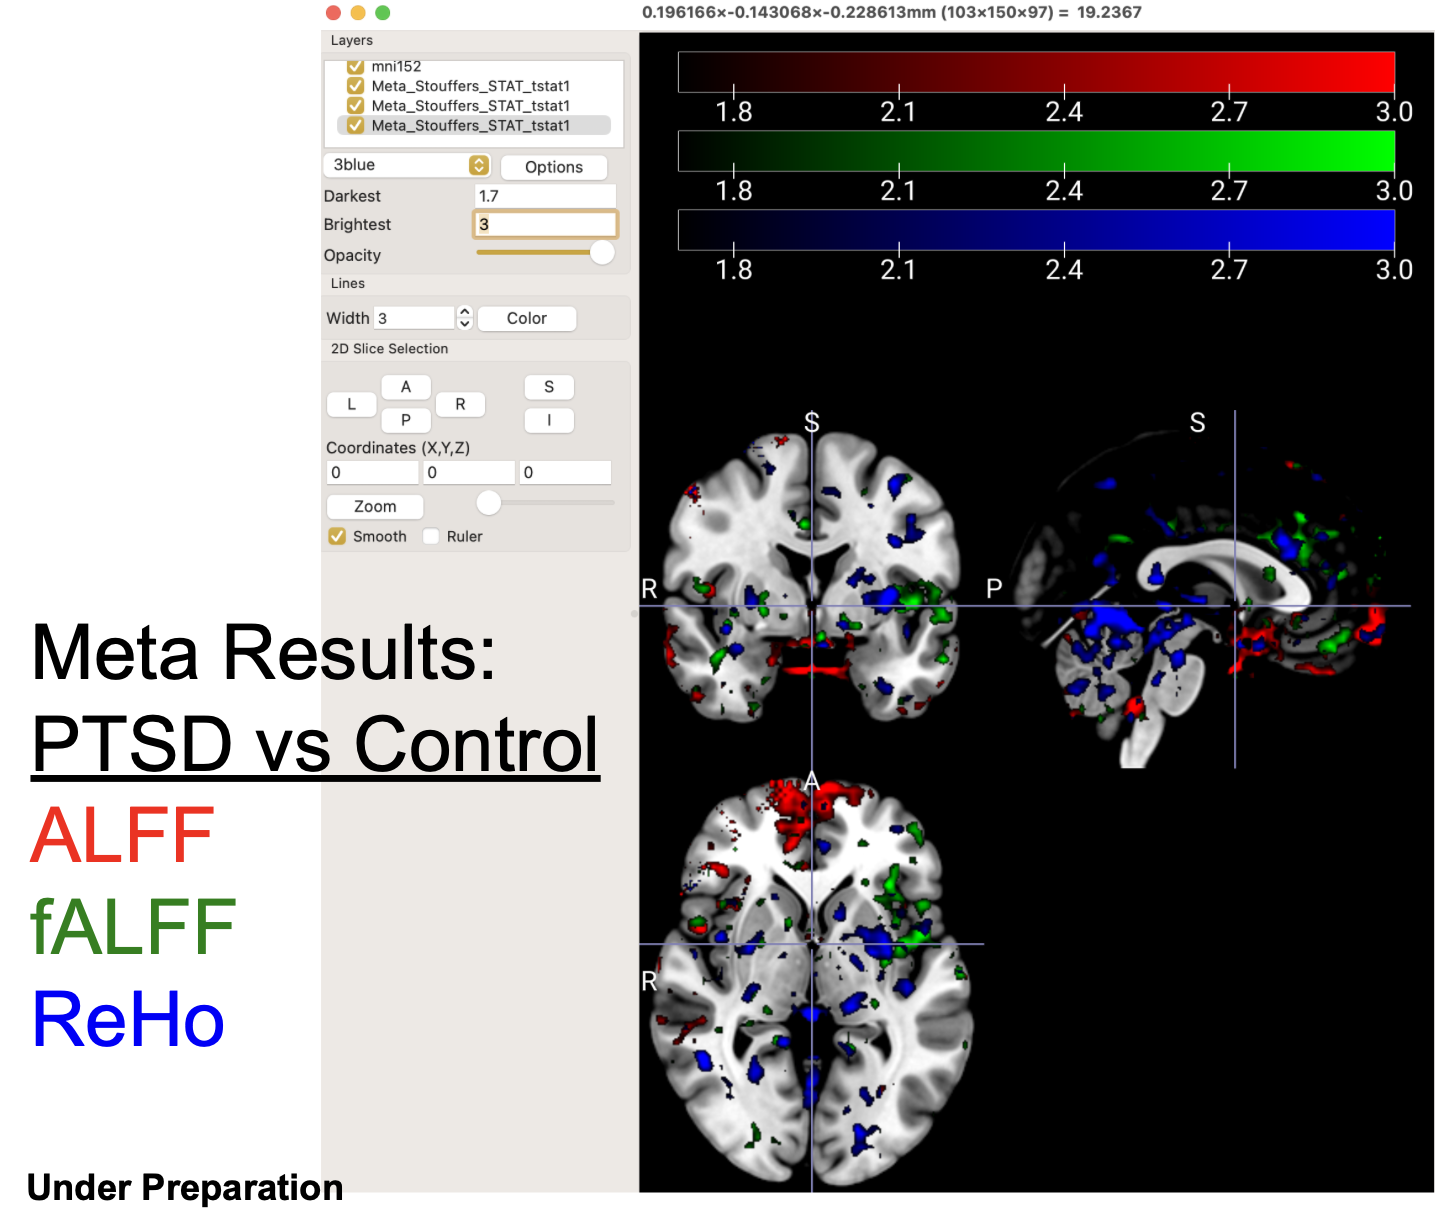
We can also compare results of different data types or preprocessing protocals:
---- Data Flexibility. Neuroimaging data presents itself in multiple formats, including 3D/4D images capturing brain structures and functions, 2D matrices representing inter-regional brain connections, and 1D values extracted from regions of interest (ROIs). The field has developed numerous specialized software packages, each tailored to specific data types, requiring researchers to invest considerable time and resources mastering multiple analytical tools.
IBMMA overcomes this fragmentation by offering a unified analytical pipeline that processes all neuroimaging data types consistently. The software accomplishes this by intelligently flattening any dimensional data into a standardized 1D format, then employing parallel processing to perform statistical analyses on individual elements, creating a seamless workflow regardless of the original data structure.
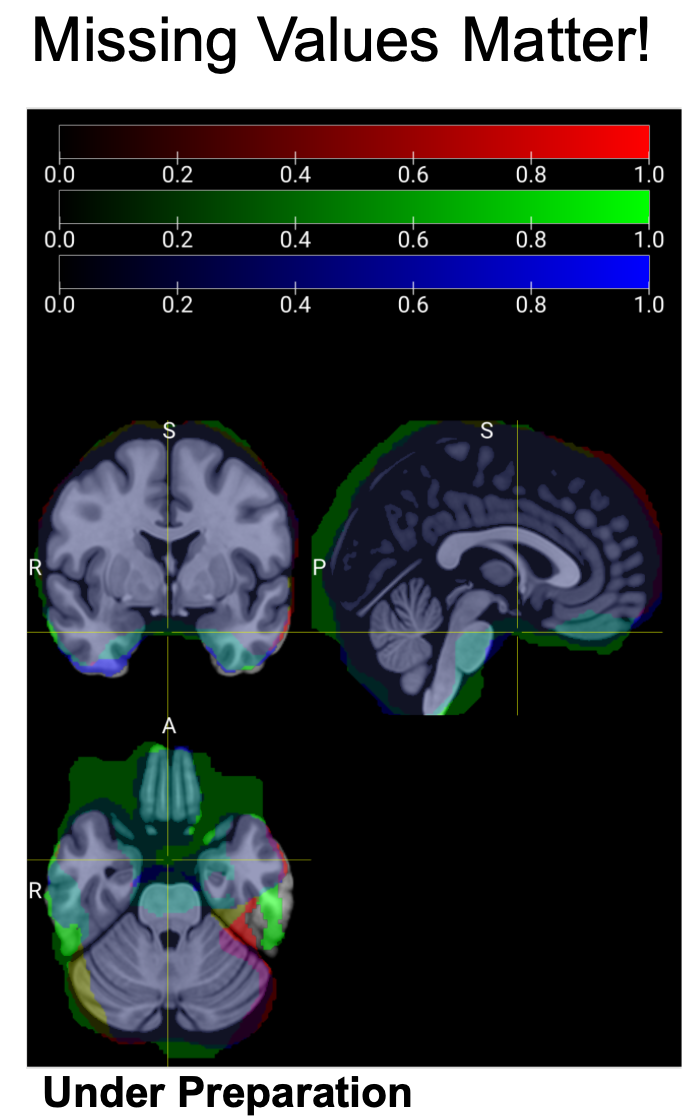
---- Missing Values. Missing values are common in neuroimaging studies due to diverse scanning protocols and image quality issues, particularly in susceptible brain regions like the ventral prefrontal cortex and ventral temporal lobe. While voxels with missing values may differ slightly among individuals from the same study site, these variations can become pronounced when comparing participants across different sites. Standard neuroimaging statistical analysis software packages, including SPM and FSL, lack proper mechanisms for handling these missing values. Consequently, if even a single participant has a missing value in a specific voxel, that voxel receives no statistical output, regardless of valid data from thousands of other participants.
This limitation creates what can be termed 'The Paradox of Large N' in neuroimaging mega- and meta-analysis: as sample size increases, the number of features (voxels, connections, etc.) that can be comprehensively analyzed across the entire sample paradoxically decreases. Some software packages exacerbate this problem by simply omitting features with missing values, which artificially inflates statistical significance due to multiple comparison corrections being applied across fewer features. Other approaches, such as HalfPipe's method of replacing missing values with zeros, introduce minimal bias in single-site studies but can significantly distort results in multi-cohort analyses, especially in brain regions with substantial site-to-site variability in missing data patterns.
IBMMA addresses these challenges through feature-by-feature statistical modeling, providing comprehensive outputs that include critical parameters such as observation counts and degrees of freedom for each analysis.
Below is an example of the inclusive masks of three participants from the same study site. It is clear that they are significantly different in brain regions especially in the ventral areas of the brain.
---- Model Flexibility. The most popular statistical models in neuroimaging studies are based on linear regressions. These typically use linear combinations of diagnosis, age, sex, and other covariates to predict brain signals across voxels. For instance: Brain ~ Diagnosis + Age + Sex. However, researchers need the ability to create more flexible statistical models to address diverse research questions. Examples include:
(a) Using linear or non-linear combinations of brain data, demographic, and clinical covariates to predict diagnosis or symptom severity: Diagnosis ~ Brain + Age + Sex;
(b) Utilizing brain data from multiple modalities: Symptom Severity ~ MRI + rs-fMRI + task-fMRI + Age + Sex;
(c) Considering more than one outcome simultaneously, such as in survival analysis: Surv(time, status) ~ Brain + covariates.
IBMMA can run multiple statistical models by calling released R and Python packages. It simplifies model settings by reading model formulas listed in 'path_para.xlsx'.
IBMMA is still in its early stages of development. Users should download the entire folder and ensure that this folder contains a file called 'path_para.xlsx' (a template for users to modify according to their own data), a file called 'ibmma.py', and a folder called 'SDL_functions'.
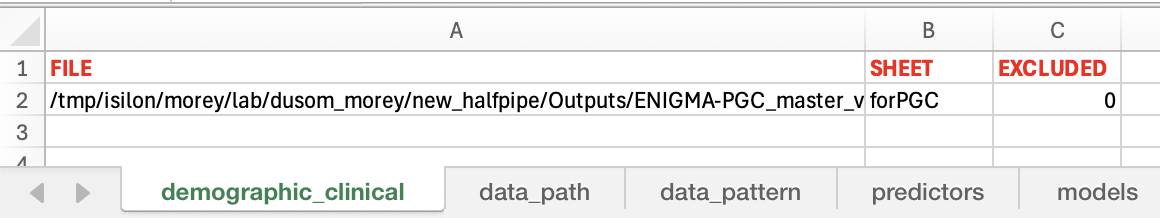
----Demographic & Clinical File Path. "FILE" lists the paths to the .xlsx file of demographic & clinical information, and the corresponding sheet name (listed in "SHEET") in this .xlsx file. The switch "EXCLUDED" (1=excluded, 0=included for analysis) is used to mark the rows that would NOT be included in analysis.
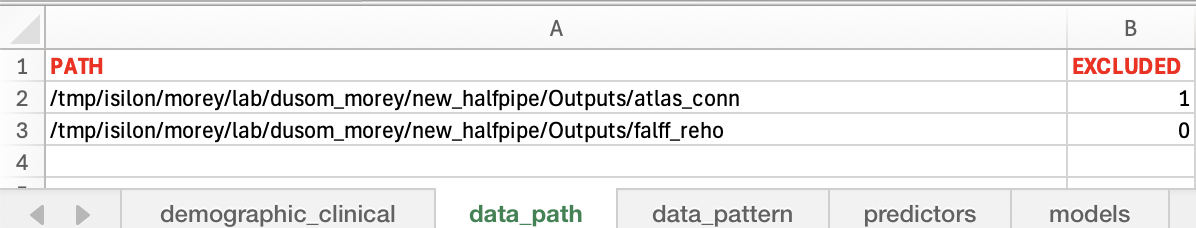
----Data Path. IBMMA does search automatically and recursively across all of the subfolders under the folders with specified "PATH" for the files of interest. The switch "EXCLUDED" (1=excluded, 0=included for analysis) is used to mark the rows that would NOT be included in analysis.
----Data Pattern. IBMMA search across the data paths for the files with keywords in their filenames. You MUST define the keywords for "DATA", and may also define the keywords for "INFO" (joson files that usually contain data information such as TR of MRI/fMRI scanning), "MASK" (i.e., subject-specific mask images), and "MASK1" (i.e., group-level mask, could be either whole-brain mask "brain_mask.nii" or grey matter mask "tpl-MNI152NLin2009cAsym_res-02_label-GM_binary_mask_80percent.nii.gz", which coould be found in the folder of "SDL_functions"). The switch "EXCLUDED" (1=excluded, 0=included for analysis) is used to mark the rows that would NOT be included in analysis.

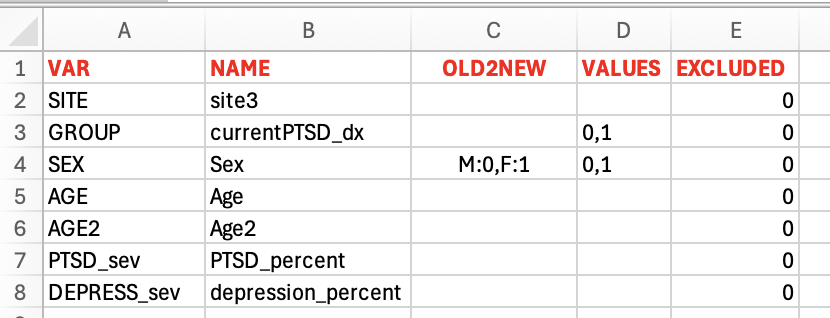
----Predictors. It helps to rename and filter the variables / variable levels of interest. "VAR" lists the variable names in the model formula, and "NAME" lists the corresponding variable names in the demographic and clinical document. "OLD2NEW" lists the conversions from the old variable levels in "NAME" and the corresponding new levels in "VAR". "VALUES" lists the variable values to be included in analysis. The cases that the corresponding variable values are not listed here will be removed from analysis. The switch "EXCLUDED" (1=excluded, 0=included for analysis) is used to mark the rows that would NOT be included in analysis.
----Models. IBMMA now incorporates R-style model formulas, eliminating the need for users to manually configure design matrices and contrasts. For instance, the formula 'lmer(Yvar ~ GROUP + AGE + AGE2 + SEX + (1|SITE))' specifies a linear mixed effects model incorporating fixed effects for categorical variables (GROUP and SEX), continuous variables (AGE and AGE2), and a random effect for SITE. The placeholder 'Yvar' represents brain features and requires no modification. Similarly, 'lmer(Yvar ~ GROUP * AGE + AGE + SEX + (1|SITE))' extends the model to include GROUP-by-AGE interaction effects.
The 'FILTER' column empowers users to selectively analyze subjects of interest without regenerating segmented data files. This feature employs an intuitive syntax: - Semicolons (;) or "AND" represent logical AND operations - Commas (,) or "OR" represent logical OR operations - Tilde (~) or "NOT" represent logical NOT operations - Parentheses () can be used to control the order of operations - Each condition can use comparison operators: ==, !=, <, >, <=, >= - Range conditions like "20 < Age < 30" are supported
If filter_string is None or an empty string, returns the original DataFrame.

Examples:
- "20 < Age < 60; Sex == Female; Gender == 1; Site == Duke, Emory; Sev == 0,1"
- "20 < Age < 30 OR Age > 60 AND Sex == Female"
- "NOT(GROUP==0 AND AGE<=10)"
- "~(Age<18) AND Site == Duke OR Emory"
- "(Site == Duke OR Site == Emory) AND Age > 40"
As a recently implemented feature, FILTER may occasionally produce unexpected results. Users may wish to set a debug breakpoint at line #55 just before 'Mega().stat(...)' to verify demographic information displayed in the terminal, or reference the equivalent data in '/Reports/datatype_xxx/Subjects/M01_Table_1.csv'. Site-specific demographic and clinical information is available in '/Reports/datatype_xxx/Subjects/M01_Table_S1.csv', while analysis-ready data resides in '/Reports/datatype_xxx/Subjects/M01.csv'.
The 'TABLE1_SITE_VAR' and 'TABLE1_GROUP_VAR' columns define grouping variables for Tables 1 and S1, respectively. Table 1 typically organizes demographic and clinical information by GROUP levels (e.g., patients versus controls), while Table S1 presents site-specific information breakdowns.

IBMMA has a pipeline to automatically run all steps of Meta-analysis (under development) & Mega-analysis. After installation, the users could run IBMMA by entering "python ibmma.py" in the terminal and wait for the final outcomes. IBMMA runs across data patterns (i.e., rows in the sheet "data_pattern") and statistical models (i.e., rows in the sheet "models"). Please be patient to large datasets from multiple study sites, with diverse data types, and multiple statistical models. You may spend several hours to get the final outputs.
Very important: fID: The subject's ID that is unique in the same dataset may be duplicated in data from different sites. For example, you may find sub_001.nii.gz in both study site A and study site B. Therefore, we need a new type of ID per observation. Here, "fID" is the combination of site name and subject's ID, e.g., Duke_sub001. IBMMA uses fID to match the demographic/ clinical information and the corresponding neuroimaging data files.
Step 1: IBMMA search all files (data, mask, and information) based on their paths and patterns (part of the filenames) listed in "path_para.xlsx". It also generates a new folder "Processes" to contain all of the temporal outputs. It generates a file called "Subjects.csv" under the folder "Processes" to store demographic, clinical, and data (paths to data) information.
-- Sheet "demographic_clinical" indicates the path to the .xlsx file and the name of the sheet for demographic and clinical information.
-- Sheet "data_path" lists the path(s) to the folders of data that were the outputs of some preprocessing softwares such as HALFPIPE.
-- Sheet "data_pattern" lists the pattern (part of a file name) of files of interest. For example, "_feature-fALFF_alff.nii.gz" for NIFTI data, "_feature-fALFF_alff.json" contains the important information to the corresponding NIFTI data, and "_feature-fALFF_mask.nii.gz" refers to the corresponding NIFTI mask.
-- Sheet "predictors" lists all variables that appear in the statistical model(s). The users can match the variables in the models to the variables listed in the file of demograohic and clinical information, and they can also match the values per variable.
-- Sheet "models" are the statistical models used for the analyses. The model formula follows R algorithm. The users do not need to figure out the complex design matrix and contrasts by themselves.
Step 2: IBMMA generates a new folder "masked" under the folder "Processes" and masks the data files (whatever NIFTI images or adjacent matrix saved in .csv files) using the mask files that have the same dimension as the data files. This step is important because some preprocessing softwares impute missing values (due to no information or low-quality values in the corresponding voxel or connection) with 0s. That may lead to wrong statistical outputs, especially for meta- & mega-analysis that are targetting data from different study sites. If there is no mask file, the data file will be used instead.
Step 3: IBMMA generates a new folder "flattened" under the folder "Processes" and flattens any kind of data into one-dimension.
Step 4: IBMMA generates a new folder "segmented" under the folder "Processes" and extracts the i th segment of the flattened data across subjects and vertically combine them into a new CSV file in which each row represents a subject. The default number of segmentation is 50.
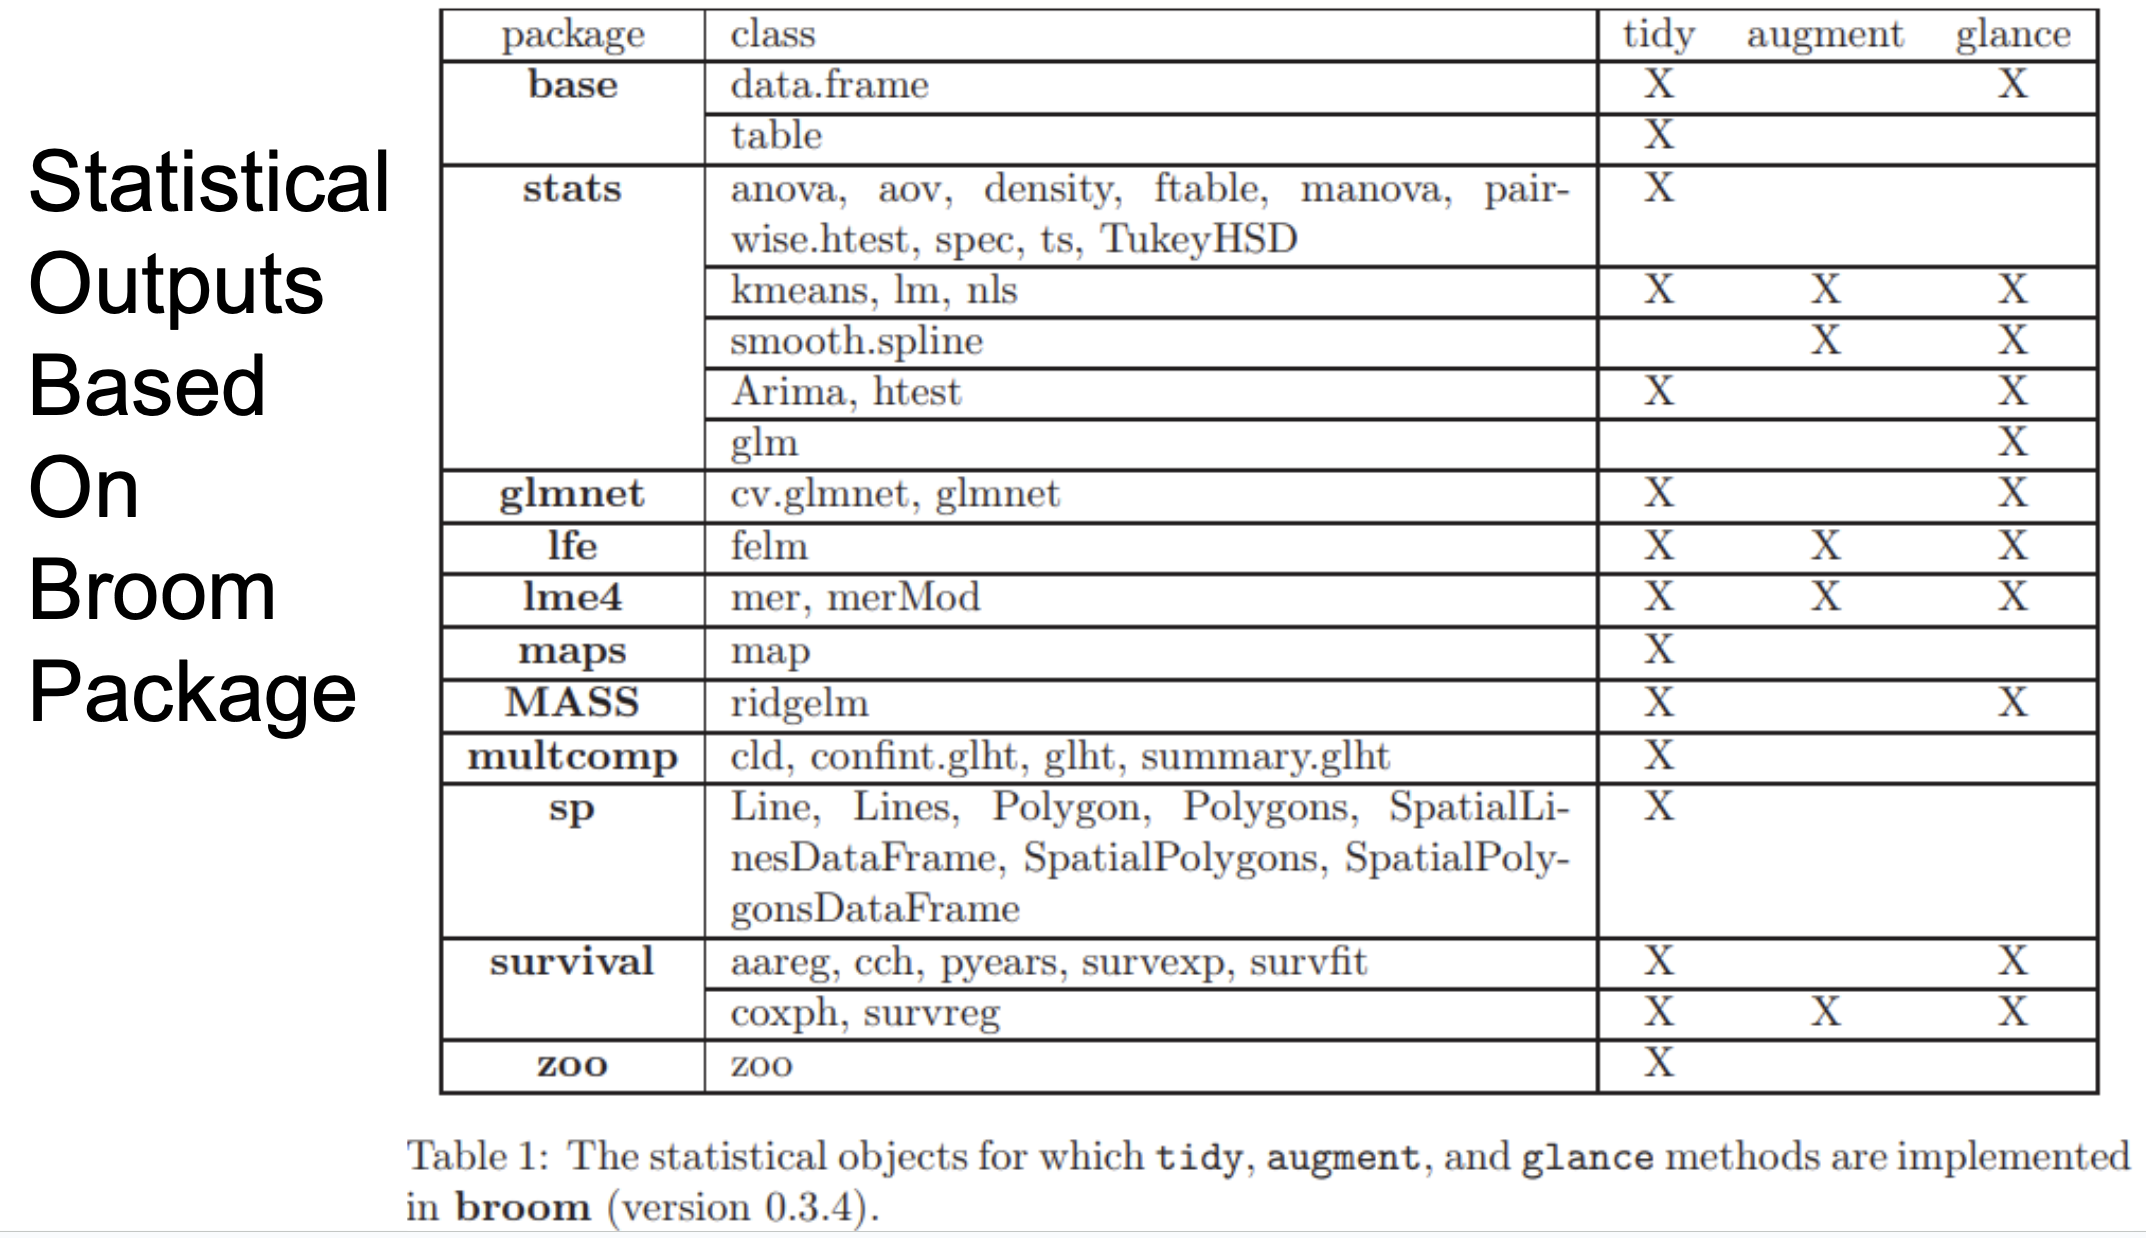
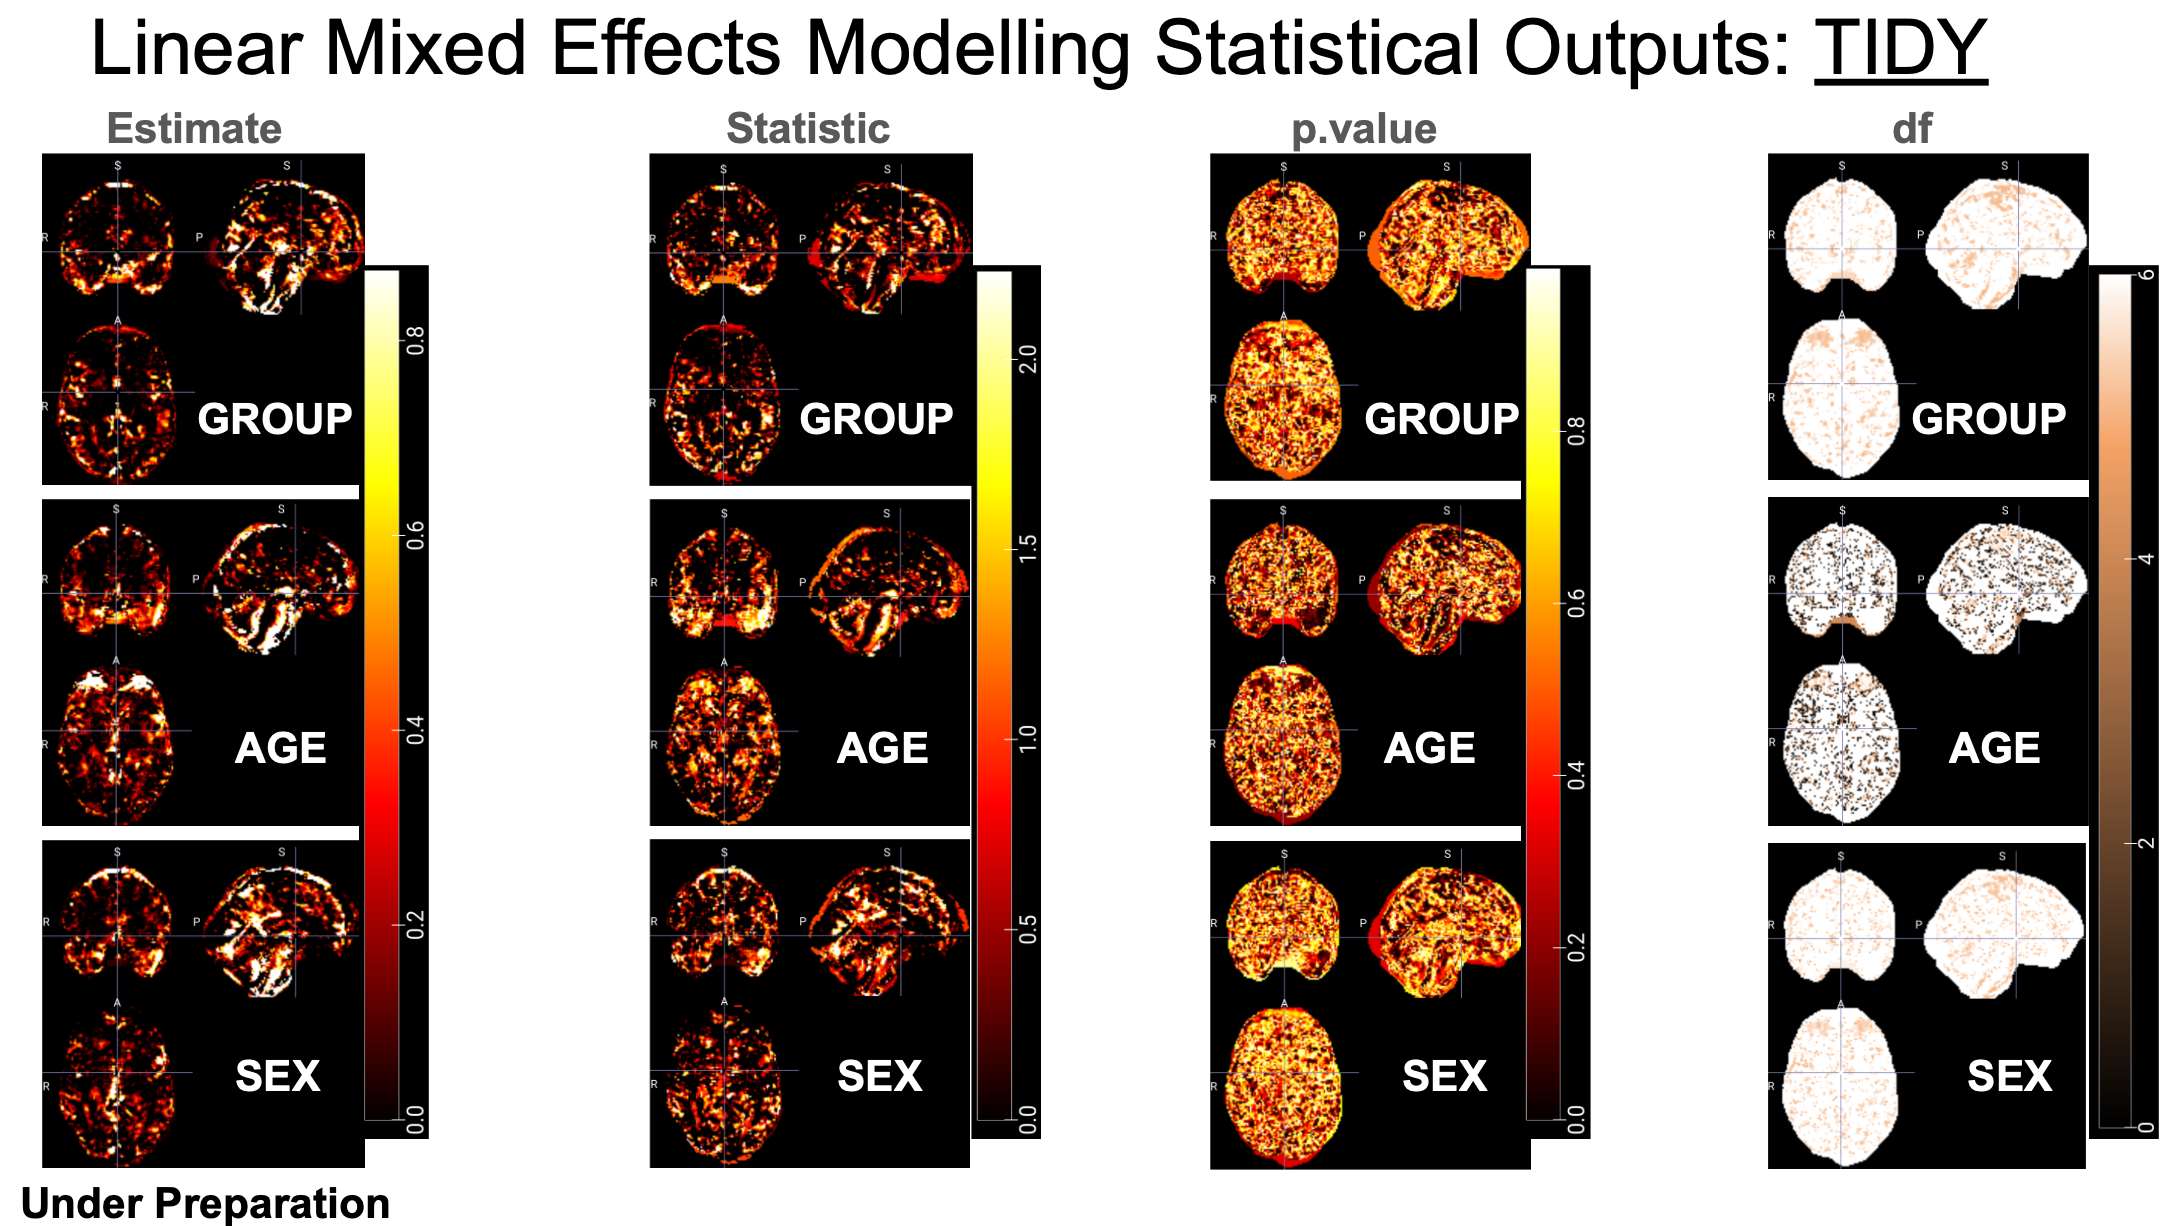
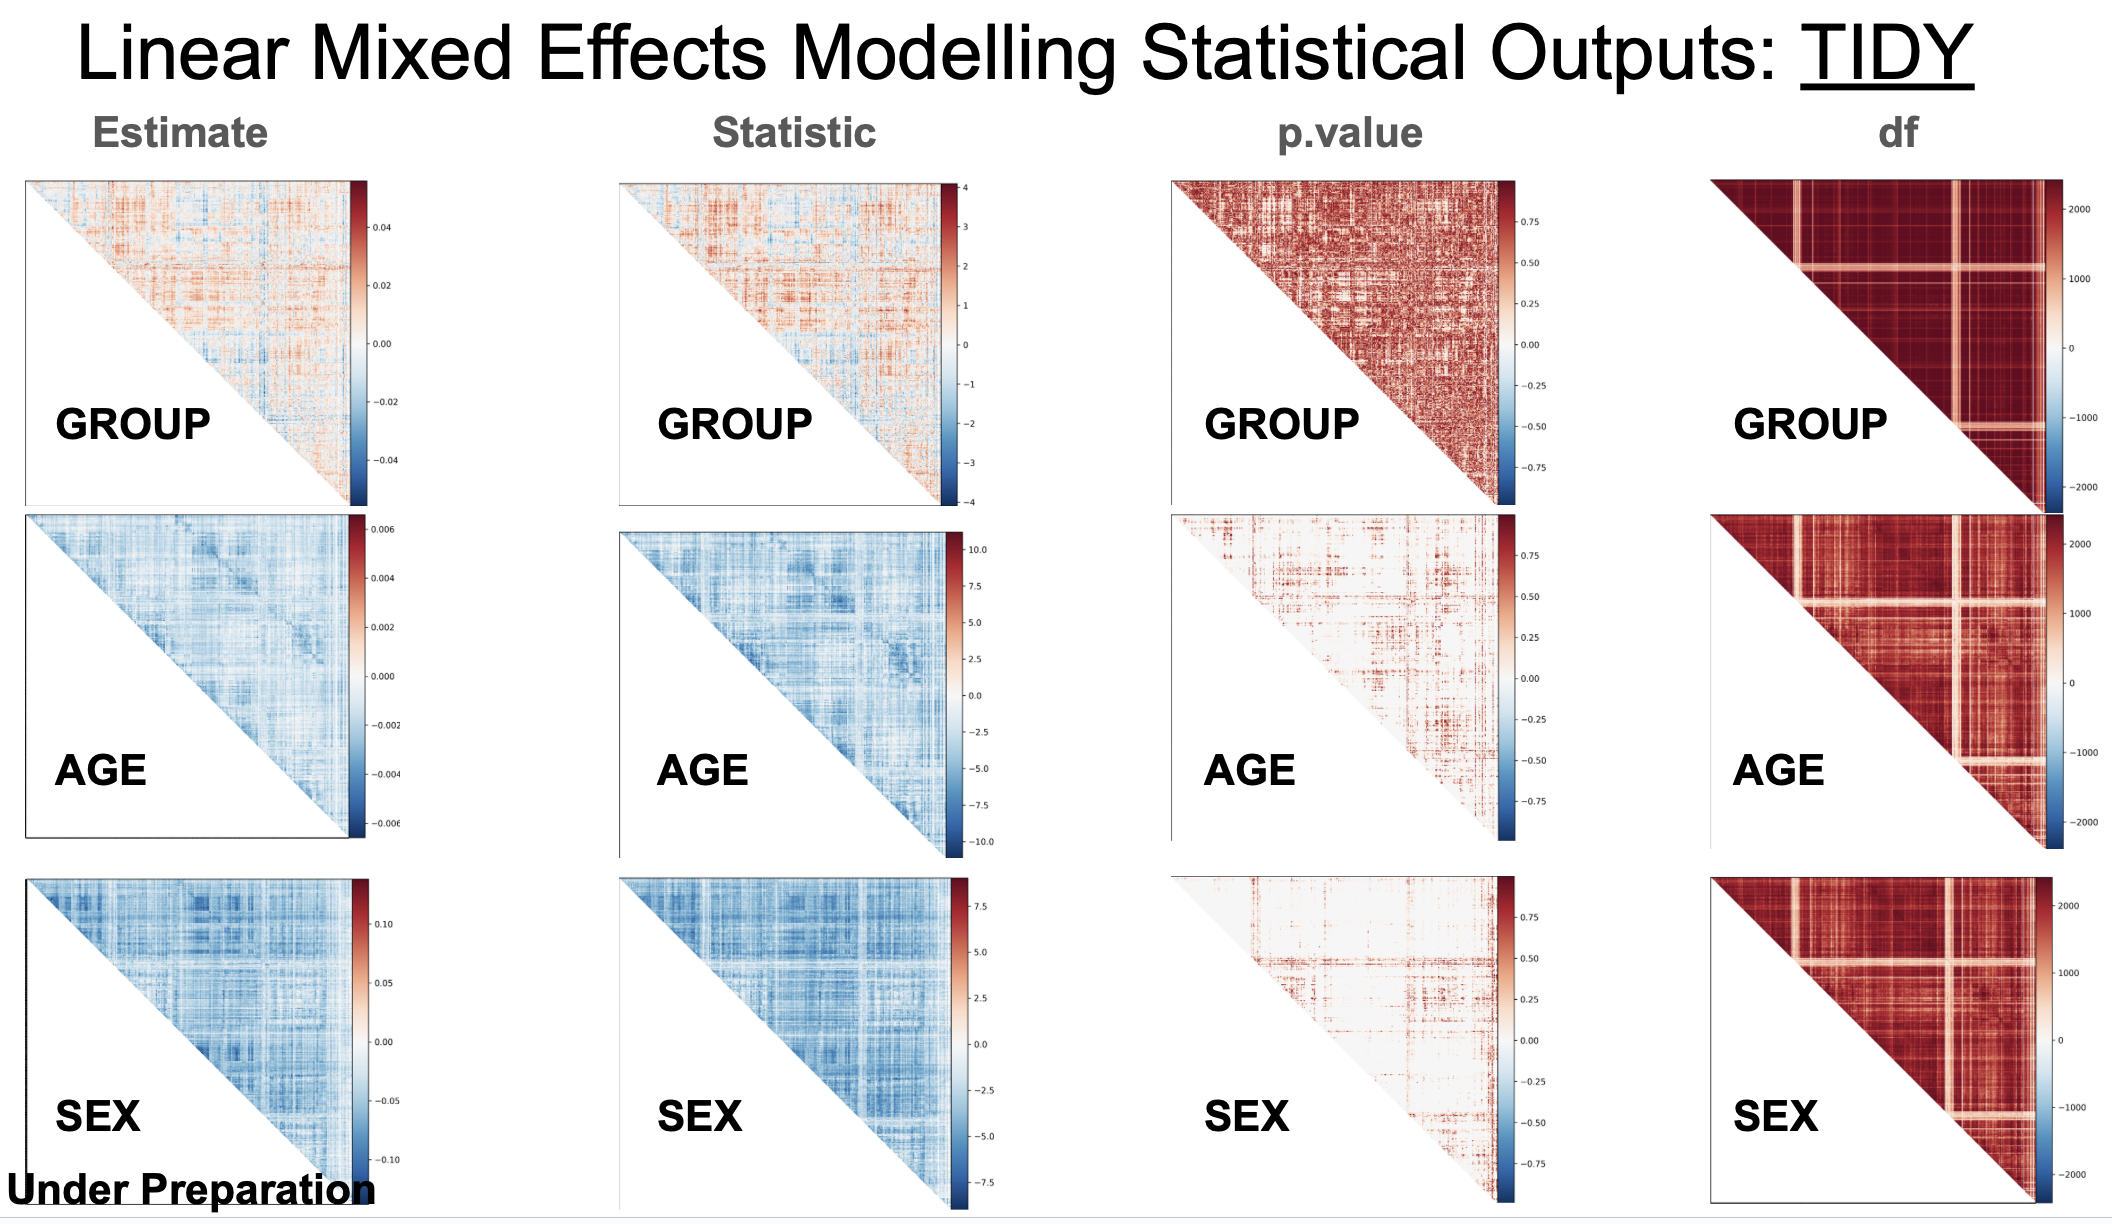
Step 5: IBMMA generates a new folder "stats" under the folder "Processes" and runs statistical modelling by calling R or Python scripts to run parallel analysis. There are two types of statistical outputs: TIDY, which includs the information that are often listed in reports and articles (such as regression coefficients, degree of freedom, T values, p values); and GLANCE, which includes estimates of model fitting (such as AIC, BIC, and number of observations). TIDY & GLANCE are from R package broom. It should be noted that, in some high performance computer (HPC) or cluster, The users need to load some module before running IBMMA. For example, enter "module load R/latest" if R was not explicited installed in your path.
Step 6: IBMMA generates a new folder folder "Results" and concatenates the statistical outputs from different degments into one.
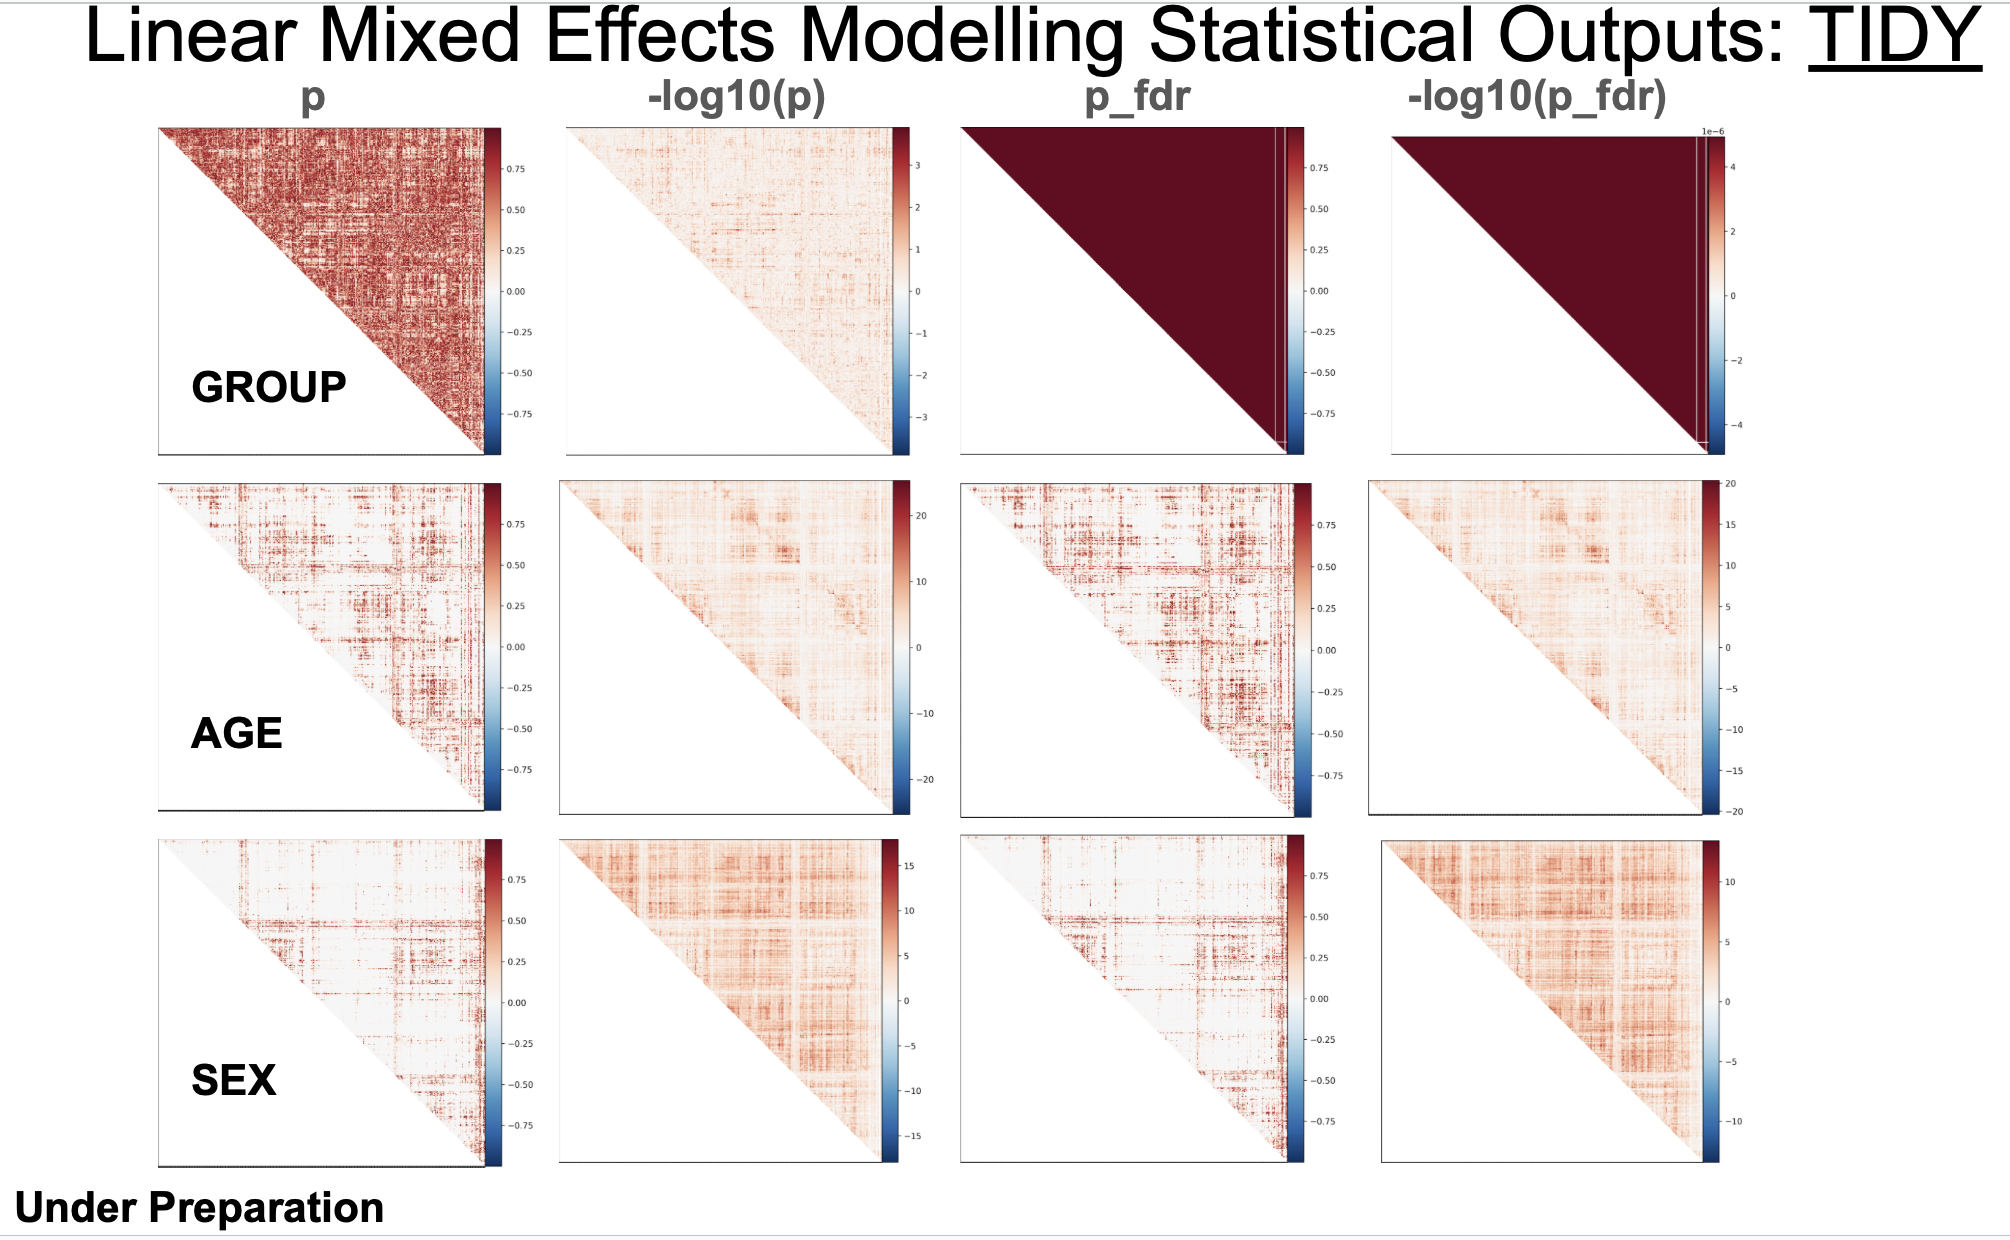
Step 7: IBMMA reverses the concatenated statistical outputs back to the original dimensions of the input data. That is to say, statistical analyses outputs for NIFTI image are still NIFTI images, and for adjacent matrix are still matrix. This step also includes FDR correction for multiple comparisons as well as negatively log10 transformed p-values for observation purpose.
In the folder "Results", users could find the subfolders with name listed in the sheet "data_pattern" column "NAME". Within each subfolder, there are two folders named "Mega" and "Meta" (under development). Within "Mega", there are two subfolder "TIDY" and "GLANCE".
In the folder "TIDY", there are subfolders:
---- "df": Degree of freedom.
---- "effect_size": Effect size (Cohen's d for categorical variables only).
---- "estimate": Regression coefficient.
---- "p.value": Uncorrected p value.
---- "p.value.fdr": FDR corrected p value.
---- "statistic": t value. A subfolder contains the pTFCE enhanced Z values for voxel-wised image analysis results.
---- "std.error": standrad error.
For example, TIDY outputs for brain images:
For another example, TIDY outputs for correlation matrix (symmetric) of ROI-to-ROI functional connectivity:
It also provides FDR_corrected p values and log10() transformed p values for observation purposes:
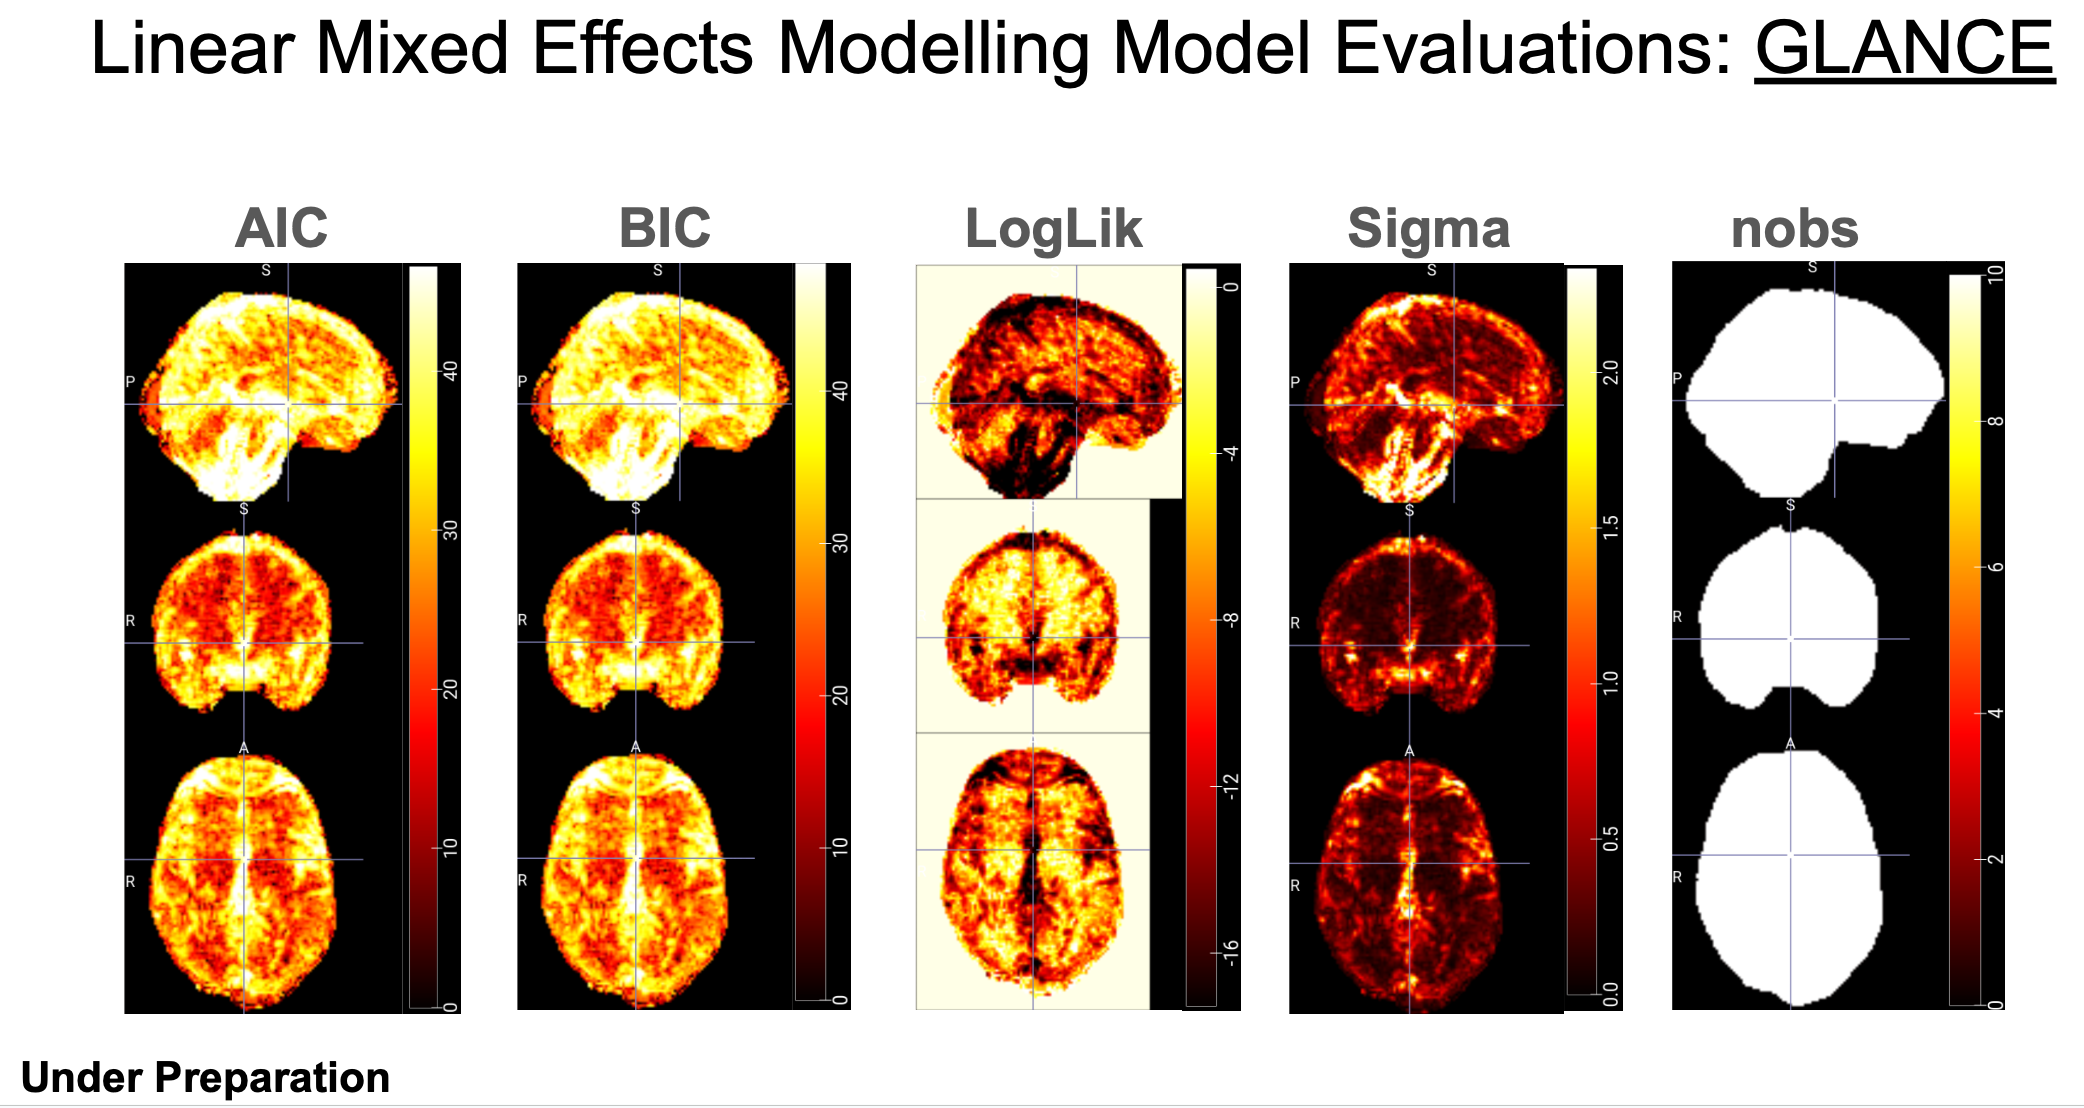
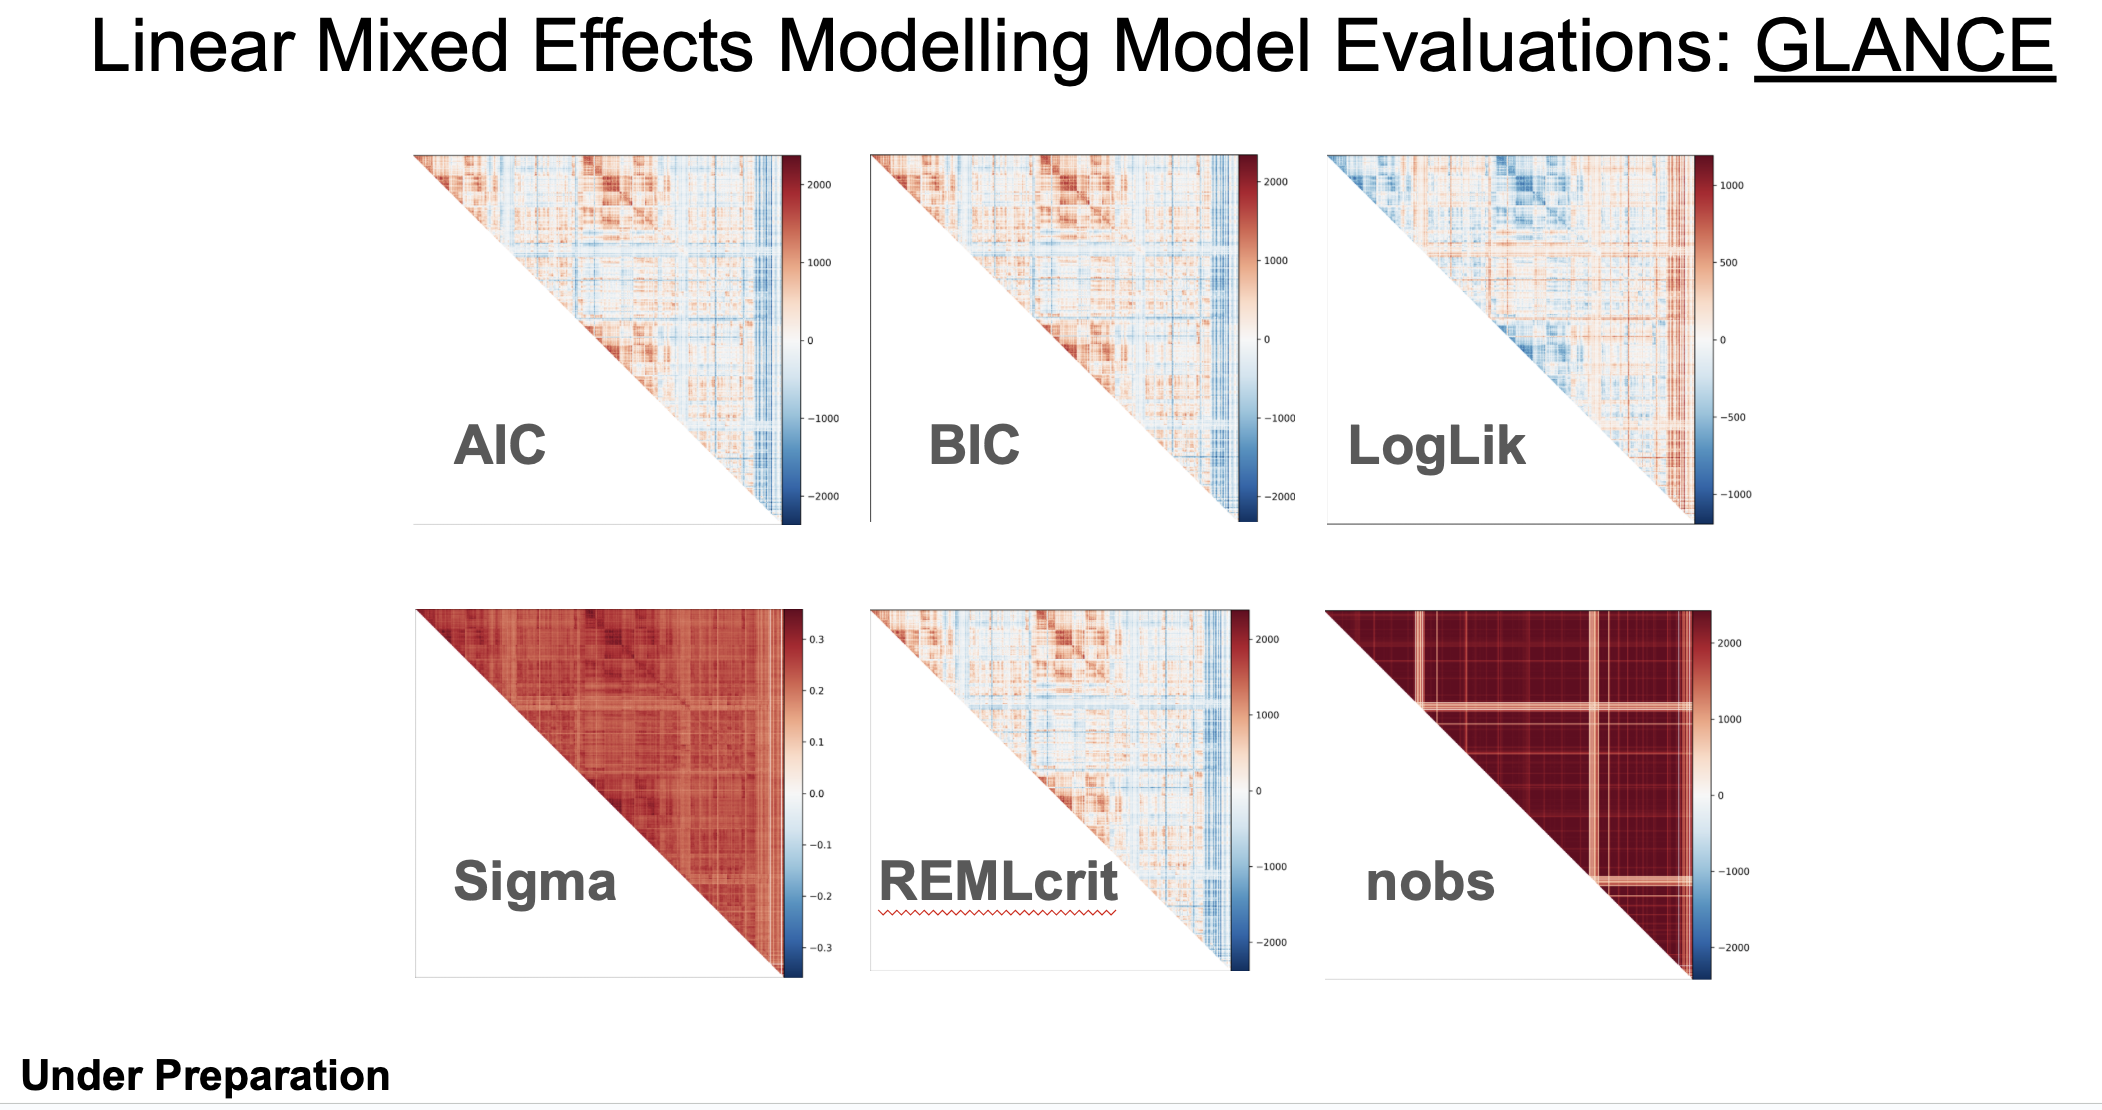
In the folder "GLANCE", there are subfolders:
---- "AIC": Akaike Information Criterion. A measure of model quality that balances goodness of fit with model simplicity. Lower AIC values indicate better models.
---- "BIC": Bayesian Information Criterion. Similar to AIC, but penalizes model complexity more strongly. Also used for model selection, with lower values being better.
---- "df.residual": Degrees of Freedom Residual. The number of observations minus the number of parameters estimated in the model. It represents the remaining degrees of freedom after fitting the model.
---- "logLik": Log-Likelihood. The logarithm of the likelihood function, which measures how well the model fits the observed data.
---- "nobs": Number of observations. The total number of data points used in the analysis. It is very important to understand how the findings are influenced by the sample size in big data analysis. IBMMA also generates folders of the number of observations per levels of categorical variables, for example, "nobs_GROUP_0", "nobs_GROUP_1", "nobs_SEX_0", and "nobs_SEX_1".
---- "REMLcrit": Restricted Maximum Likelihood Criterion. A criterion used in mixed-effects models for estimating variance components. It's an alternative to maximum likelihood estimation.
---- "sigma": Residual Standard Error. An estimate of the standard deviation of the residuals in a regression model. It measures the average distance between the observed values and the predicted values.
For example, GLANCE outputs for brain images:
For another example, GLANCE outputs for correlation matrix (symmetric) of ROI-to-ROI functional connectivity:
Step 7: IBMMA generates a dedicated 'Reports' folder containing HTML reports of publication-ready findings. Within this folder, users will find subfolders named according to the values specified in the 'NAME' column of the 'data_pattern' sheet. Each subfolder contains three organizational directories: 'Mega', 'Meta' (currently under development), and 'Subjects'.
Effects of interest are systematically organized within subfolders under the 'Mega' directory, containing outputs from various statistical models. For example, GROUP effects might be analyzed through multiple complementary approaches: model M01 'lmer(Yvar ~ GROUP + AGE + AGE2 + SEX + (1|SITE))', model M02 'lmer(Yvar ~ GROUP * AGE + AGE2 + SEX + (1|SITE))', and model M03 'lmer(Yvar ~ GROUP * SEX + AGE + AGE2 + (1|SITE))'.
To review comprehensive statistical outputs, simply left-click the 'index.html' file in the corresponding folders. All results presented have successfully passed rigorous multiple comparison corrections—family-wise error (FWE) correction for voxel-wise images or false discovery rate (FDR) correction for connectome analyses—with a conservative threshold of q < 0.05.
Several modules and functions have been planned to be incorporated into IBMMA in future versions:
---- Flexible reports. The HTML reports only give the findings survived correction for multiple comparisons. The updated IBMMA will allow users to observe results through self-defined threshold (e.g., p_unc < 0.001, or Z > 3.1 AND nobs > 500).
---- Flexible pipeline. The current IBMMA pipeline consolidates all steps within a single script, 'ibmma.py'. The forthcoming update will introduce enhanced modularity, allowing users to execute specific workflow segments (such as the preliminary steps before Mega().stat(), facilitating verification of subject inclusion). Moreover, customizable parameters (e.g., the number of CPUs and the number of segmentations) will be implemented through a new 'Parameters' sheet in the 'path_para.xlsx' configuration file, providing greater control over the analytical process while maintaining the pipeline's streamlined structure.
---- Multiple data format. The current version is for the functional neuroimaging data (voxel-based images in *.nii.gz format or connectom-based matrix in .csv format) preprocessed by softwares such as HALFPIPE. The updated IBMMA version will have the ability to do analyses on any format of neuroimaging data, such as cortical thickness, surface area, and gyrification.
---- Normative modeling. Normative modeling is an emerging and innovative framework for mapping individual differences at the level of a single subject or observation in relation to a reference model (see https://www.nature.com/articles/s41596-022-00696-5). Future versions of IBMMA may add this function to chart centiles of variation across a population in terms of mappings between biology and behavior, which can then be used to make statistical inferences at the level of the individual.
---- Collaboration with DS (Deep Simple) package (https://github.com/sundelinustc/Deep_Simple) to promote manuscript preparations.
---- Distributed computing resources. Take advantage of parallel processing across multiple nodes or cores using R packages such as Rmpi (https://cran.r-project.org/web/packages/Rmpi/index.html).