





Self-hosted website and API uptime monitoring with alerts, public status pages, cert checker, and optional multi-location consensus. Runs on the SpyWeb engine which is a single binary plus static files, no runtime to install.
- Demo
- What It Does
- Features
- Install
- First Run
- Using the Dashboard
- Monitors
- Alerts
- Public Status Pages
- Cluster
- Instance Settings
- Performance and Tuning
- Data, Retention and Backup
- Updating
- Deployment and Remote Access
- Security
- Development and Customization
- License
Try the live demo at https://uptyme.spyweb.app/.
API key: demo
The demo is public and shared: its data gets reused by anyone who visits it and is occasionally nuked and reset. Don't put anything sensitive in it.
The demo is a central install: its check tick is 10 minutes (default ships 60 seconds), so a monitor you add there is first checked within ~10 minutes regardless even if you put 1s interval, and appears in the dashboard seconds after that check.
UPTYME checks your websites and APIs on a schedule, records every result, and alerts you when something breaks.
- You add a monitor - a URL, a method, how often to check, and optionally some text that must appear in the response.
- UPTYME checks it on its schedule and stores each result (status code, response time, error) in a local SQLite database.
- When a monitor changes state, alerts go out through the notification channels you assigned to it.
- You watch it all in a dashboard, and optionally share selected targets as public status pages.
Everything runs on your machine. The only outbound traffic is the checks themselves plus the alerts you configured.
- 🖥️ Cross-platform: Linux, macOS (Intel and Apple Silicon), Windows
- 📦 Zero dependencies: one binary plus static files, no runtime required
- 🌐 Monitor any URL: HEAD, GET, POST, PUT, PATCH, DELETE with configurable intervals
- 🔍 Content checking: mark a monitor DOWN when expected text is missing from the response
- 🔒 TLS certificate monitoring: alert before a certificate expires
- 📊 Uptime tracking: 24h, 7d and 30d percentages with response-time history
- 📄 Public status pages: shareable slug-based pages for one monitor or a group
- 🔔 Notification channels: Discord, Slack, ntfy, webhooks, email - SendGrid (ON/OFF per channel)
- 💻 Desktop notifications: native OS alerts when a monitor goes down
- 🌍 Multi-node cluster: central + checker roles with cross-location consensus to reduce false positives
- 📥 Import/Export: bulk import monitors from JSON or CSV, export them back out
- 🌙 Dark and light theme: responsive dashboard
- 💾 SQLite storage: a single queryable database file
- 🧹 Automatic cleanup: old records purged daily based on your retention setting
Pick one of the two options below. There is no build step and no toolchain to install. The dashboard ships pre-built.
Downloads UPTYME and the matching SpyWeb binary for your OS into a ./uptyme directory.
macOS / Linux:
curl -sSf https://uptyme.spyweb.app/setup | bashWindows (PowerShell):
irm https://uptyme.spyweb.app/setup-win | iexThen continue to First Run.
Two downloads, extracted into the same folder.
1. Download the UPTYME release for your platform from the latest release (uptyme.tar.gz or uptyme.zip) and extract it. You'll get an uptyme/ folder containing the backend, the job configs, and the pre-built dashboard in ui/.
2. Download the SpyWeb binary. UPTYME stores its data in SQLite, so you need the SQL variant. The default (KV) build will not work.
3. Copy just the binaries into the UPTYME folder. Move spyweb (and optionally spyweb-tray) into uptyme/.
Don't extract the SpyWeb archive over the UPTYME folder. SpyWeb's archive ships its own default
jobs/andui/folder.
uptyme/
  spyweb              # the server binary (you run this)
  spyweb-tray         # optional: desktop tray version
  ui/                 # the pre-built dashboard (served by spyweb)
  jobs/               # check + cluster schedules
  config.lua.example  # multi-node config template (ignore if single node)
  server/             # API routes and handlers
  data (-shm,-wal)    # SQLite database created on first run
data is the only file that matters for backups. Everything else can be re-downloaded or re-extracted.
cd uptyme
./spyweb start          # Windows: .\spyweb.exe start
Open http://localhost:7979 and add your first monitor.
Useful flags:
./spyweb start --port 9000        # different port
SPYWEB_PORT=9000 ./spyweb start   # same thing via environment variable
./spyweb start -q                 # warnings and errors only
Desktop users: you can run spyweb-tray instead of spyweb to run silently in the background with a system tray icon.
| Page | What it's for |
|---|---|
| Dashboard | At-a-glance health: up/down/unknown/disabled breakdown, 30-day uptime chart, recent incidents, monitors that need attention, slowest monitors, and checker health (central nodes only) |
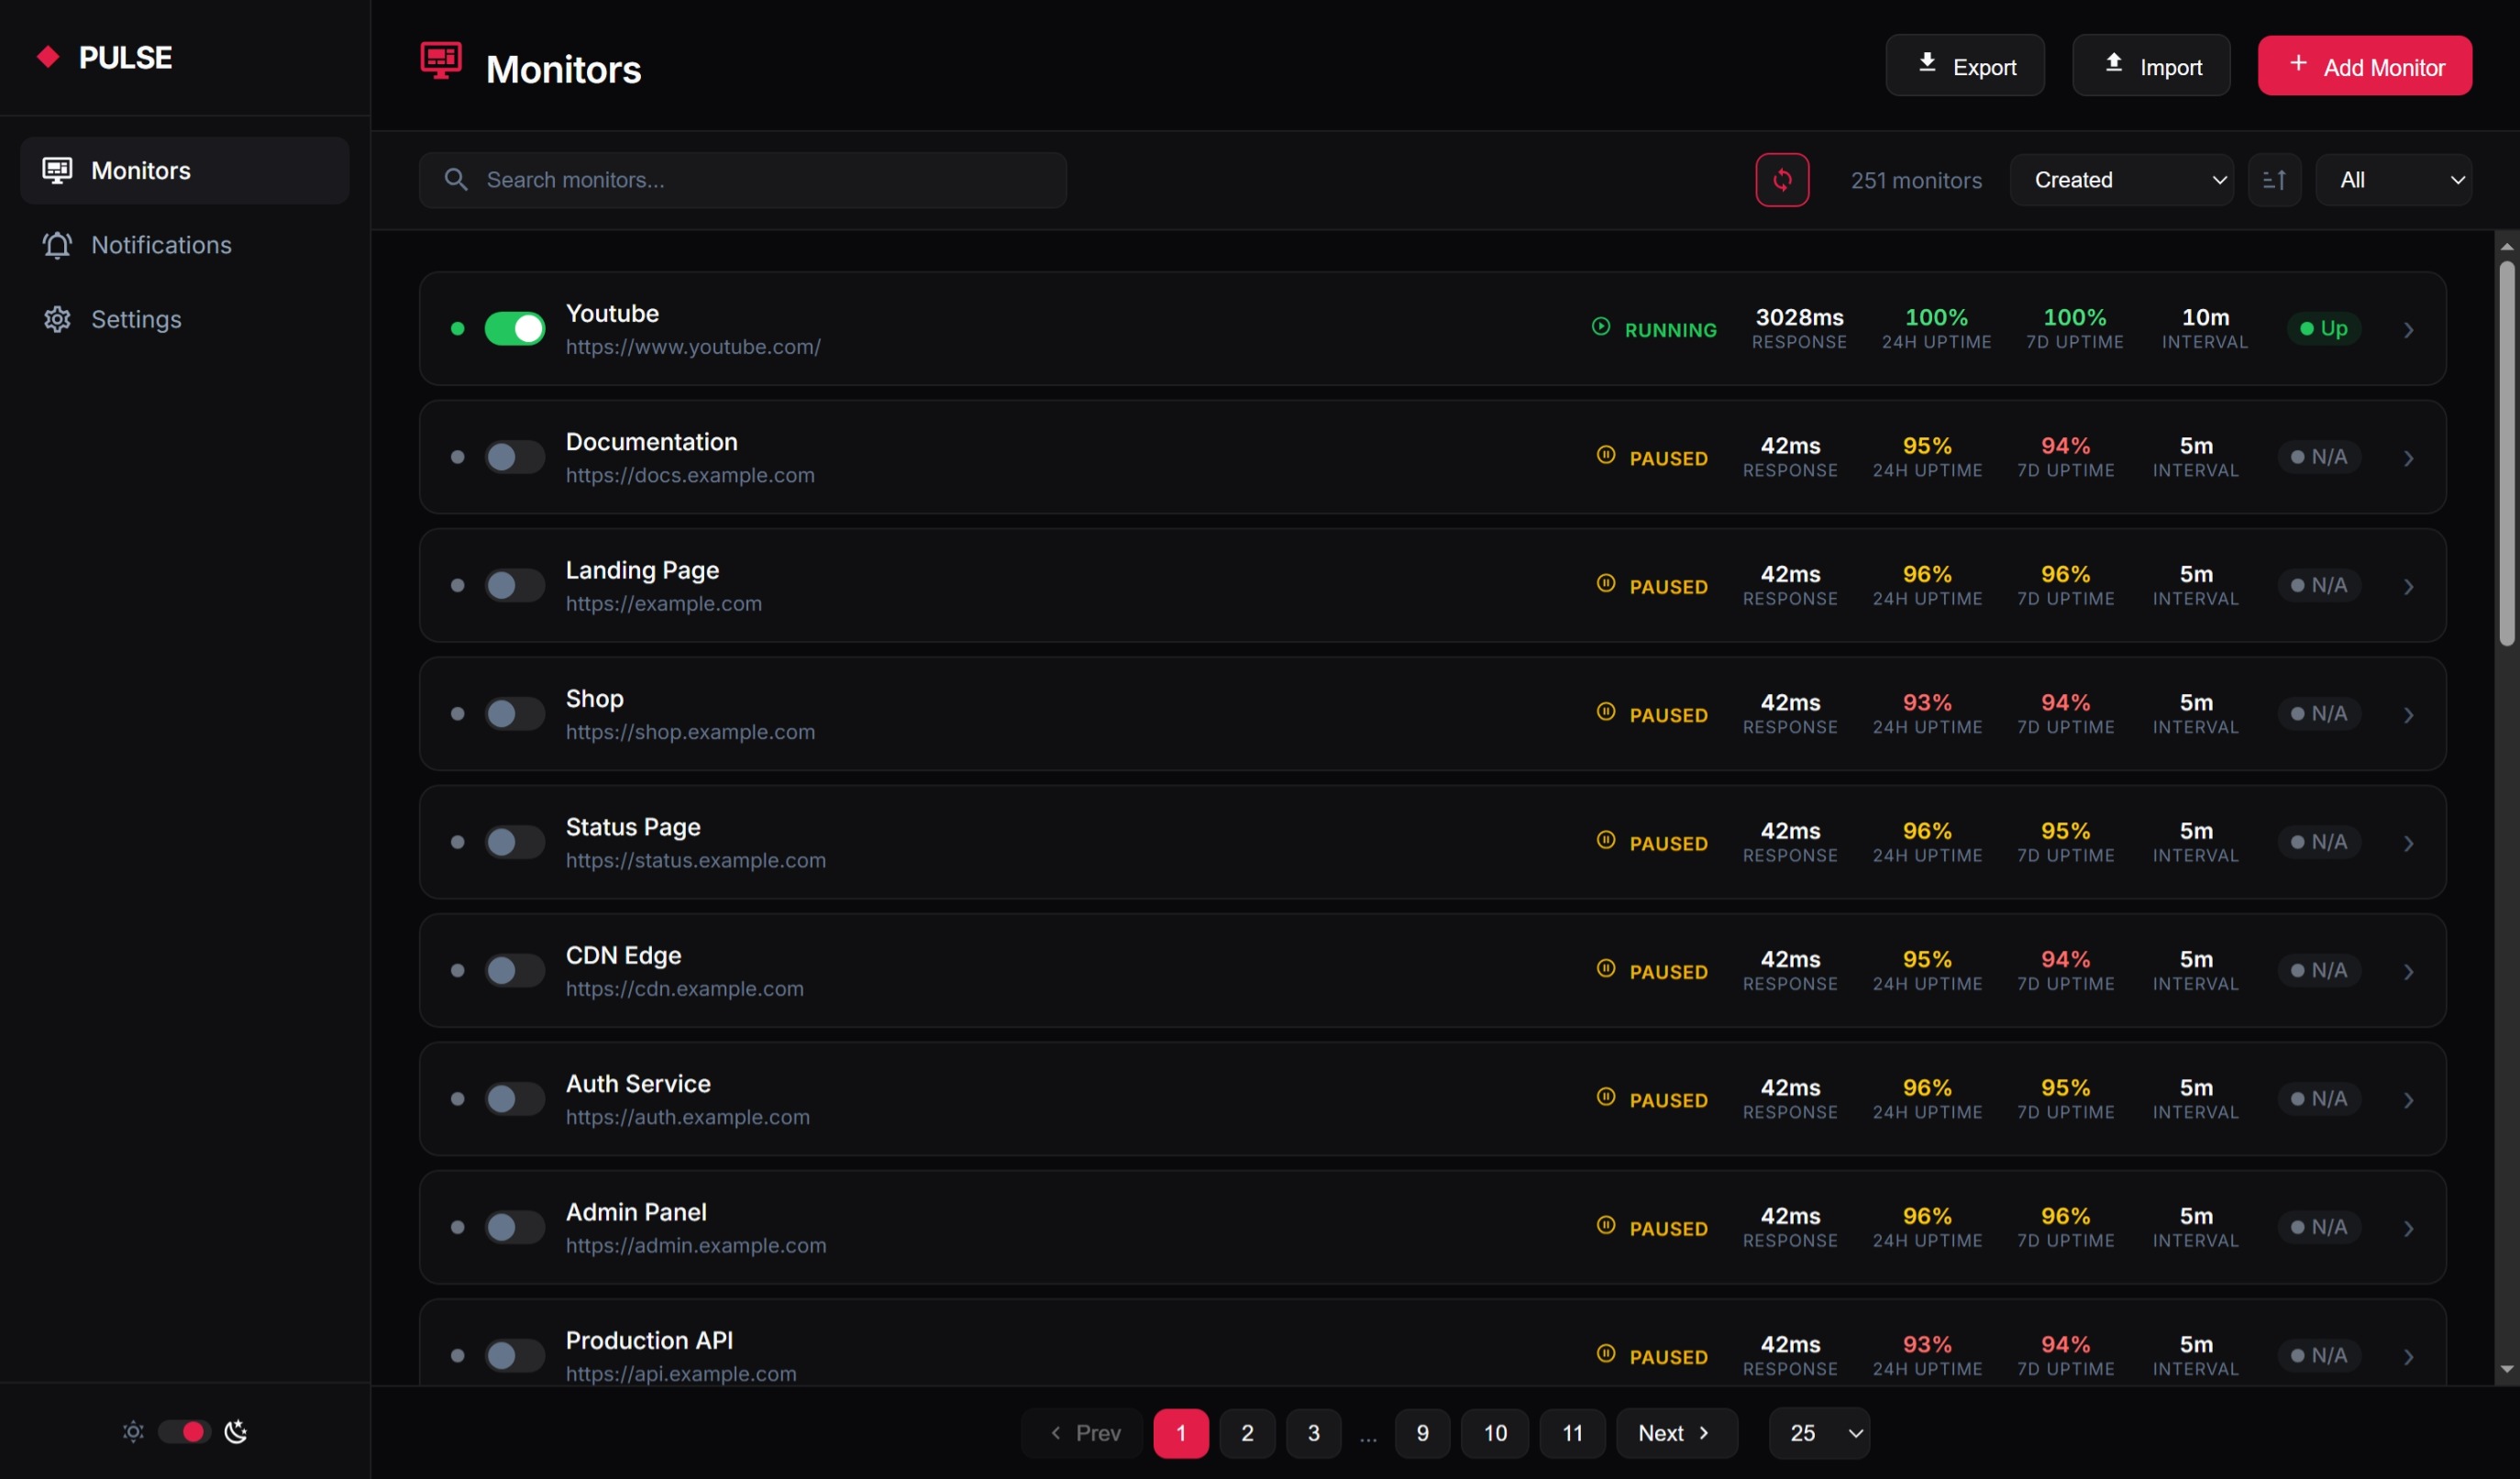
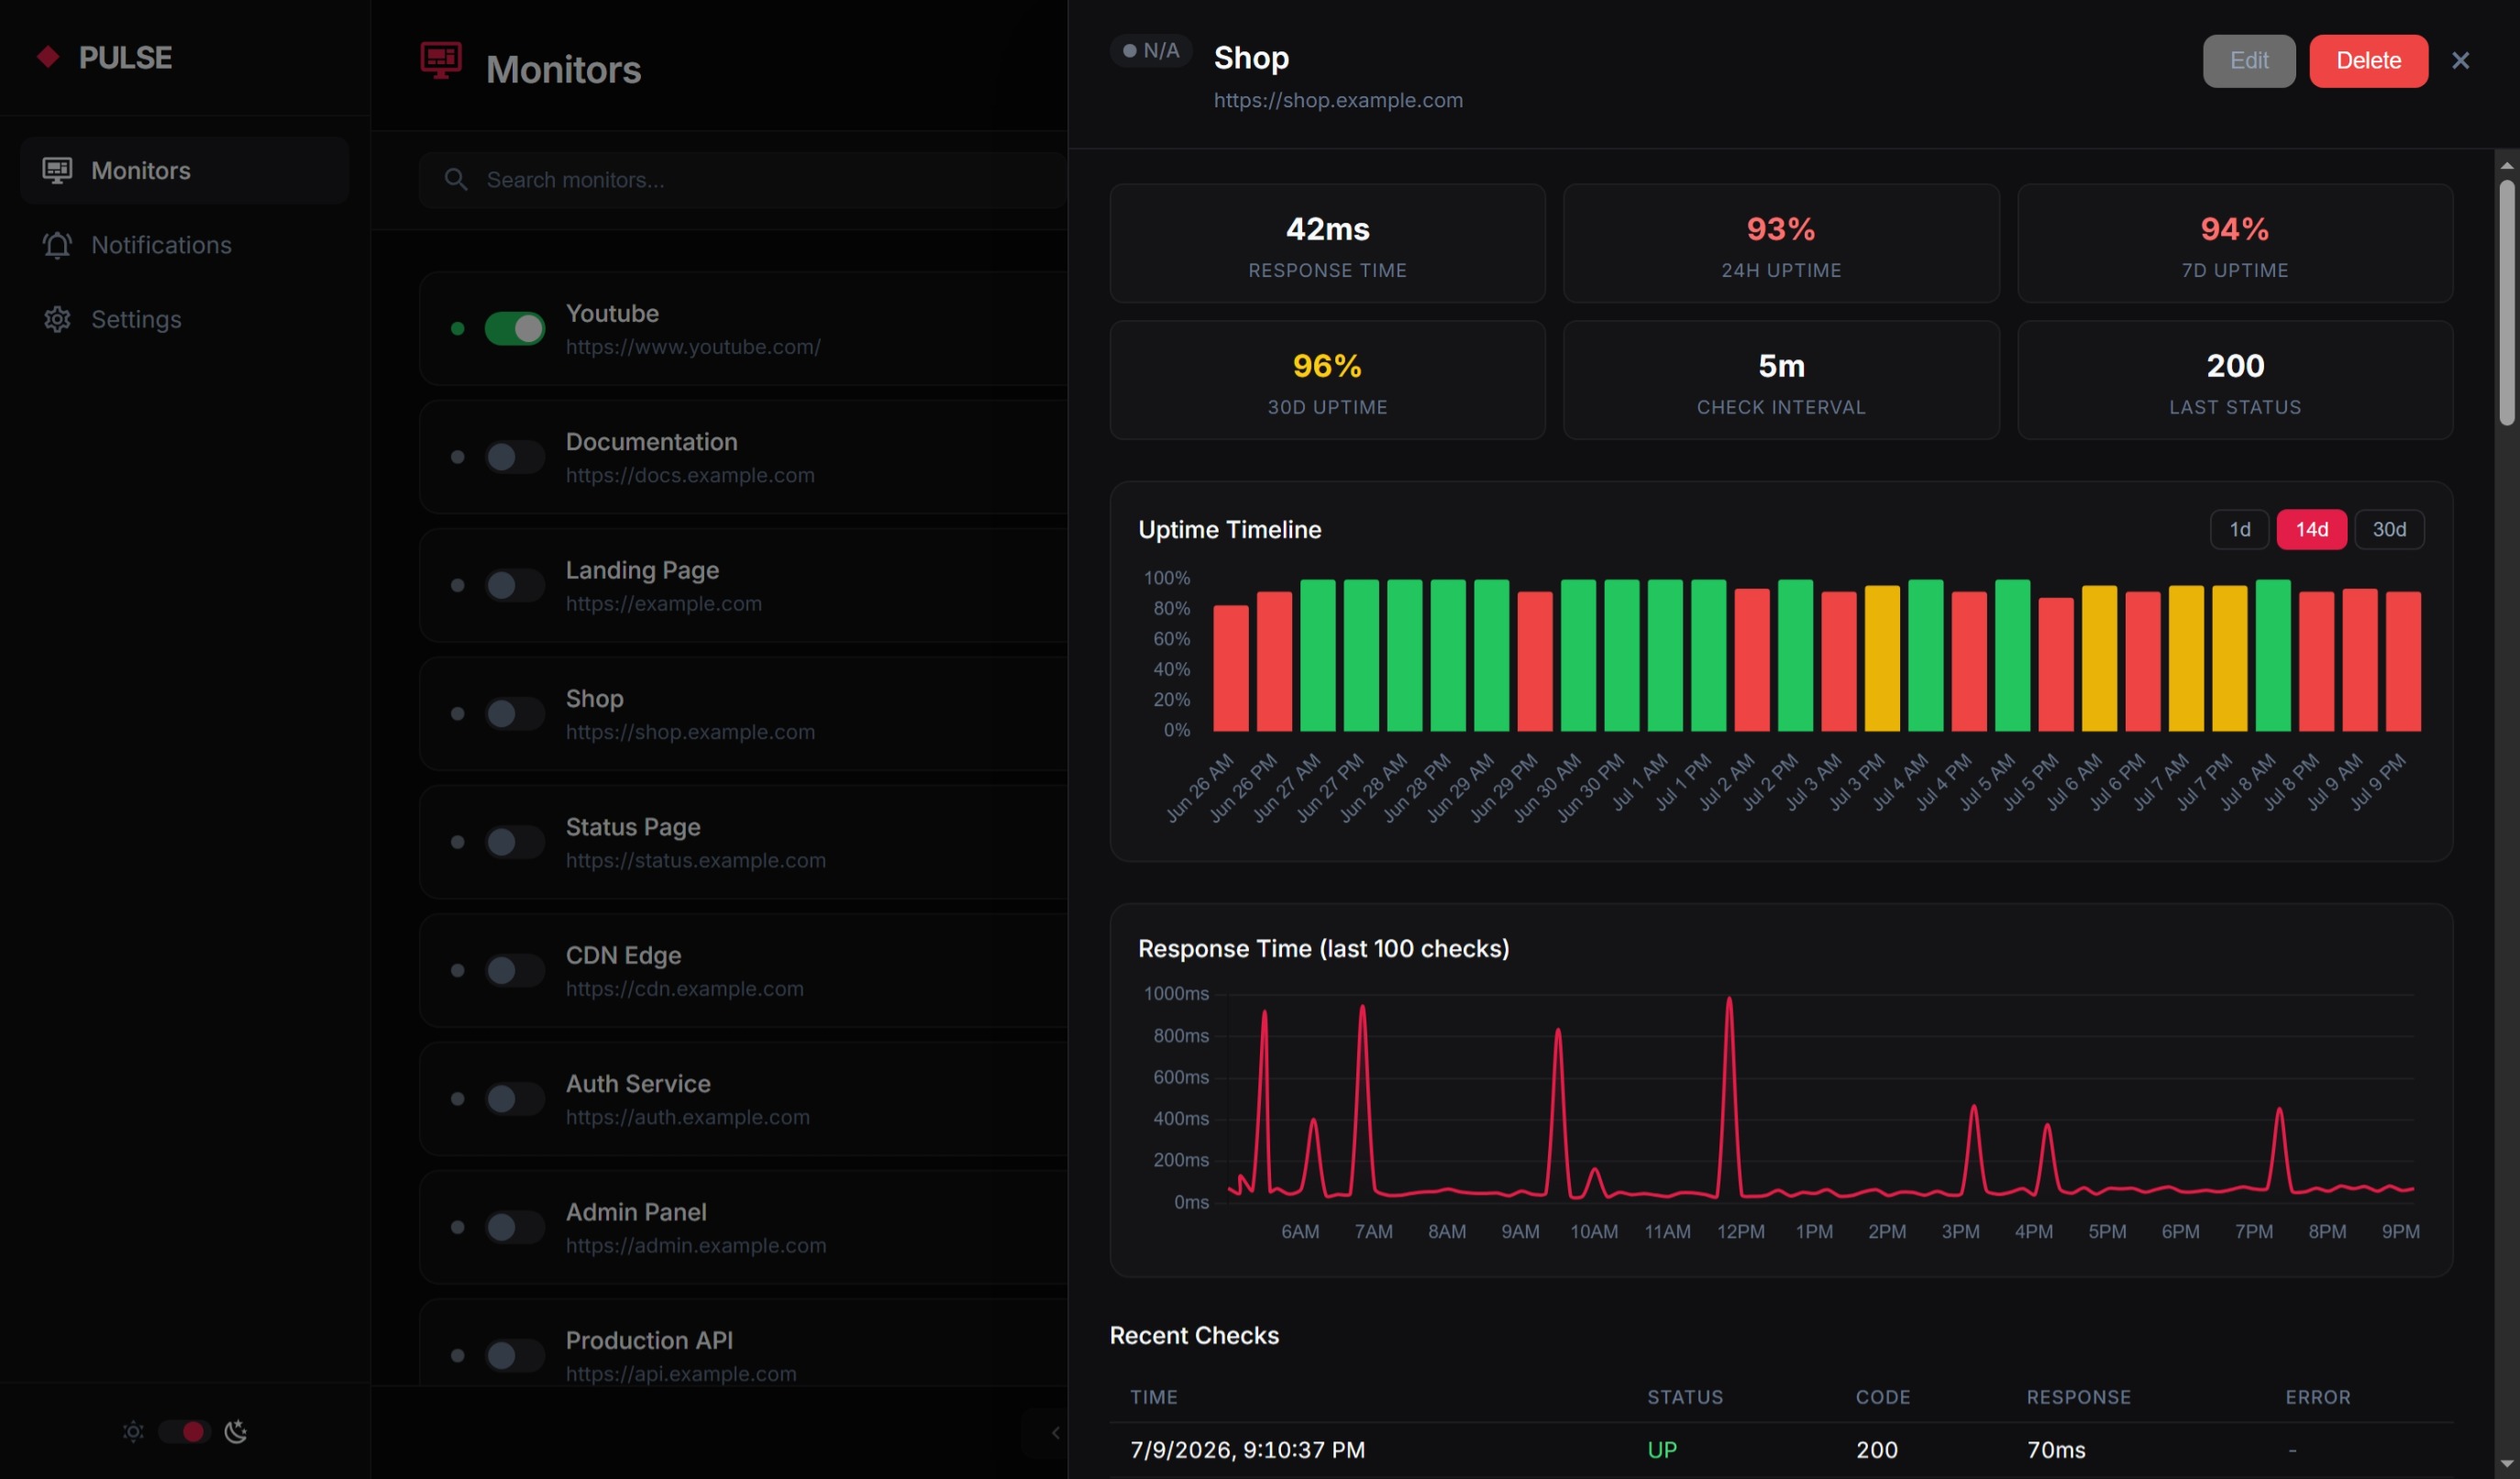
| Monitors | Create, search, sort, filter and paginate monitors; import/export; open a monitor for its uptime timeline, response-time chart, recent checks and certificate info |
| Notifications | Add, test, enable/disable and edit alert channels |
| Nodes | Add and manage checker nodes (central nodes only) |
| Status Pages | Create, preview, publish and edit public status pages |
| Settings | Instance-wide options (see Instance Settings) |
Every monitor has an enabled toggle. Disabled monitors are not checked and disappear from public status pages, but their history is kept.
| Field | Description | Default |
|---|---|---|
| Name | Display name (max 255 chars) | required |
| URL | Must start with http:// or https:// (max 2048 chars, unique) |
required |
| Method | HEAD, GET, POST, PUT, PATCH, DELETE |
HEAD |
| Interval | Check frequency in seconds (10 - 86400) | 300 (5 min) |
| Timeout | Request timeout in milliseconds (1000 - 60000) | 10000 (10s) |
| Content Check | Text that must be present in the response body (max 1000 chars) | empty |
| Check Certificate | Probe TLS certificate expiry (HTTPS only) | off |
| Cert Threshold | Days before expiry to alert (1 - 365) | 14 |
| System Notify | Show a desktop notification when this monitor goes down | off |
Each URL can be monitored once. Adding a duplicate URL is rejected, and duplicate rows in an import are counted as skipped.
- Status codes:
2xxand3xxare UP.4xxis BLOCKED (amber, not counted as down) unless you enable Treat 4xx responses as DOWN in Settings.5xx, timeouts and connection errors are always DOWN. - Redirects: followed automatically, only the final response is classified, so you normally see the final status code. A redirect loop burns through the client's redirect limit and counts as DOWN with the error
too many redirects. - Content check: when set, the check switches to a
GETand the monitor is marked DOWN if the text isn't found in the response body. - Uptime: successful checks ÷ total checks, shown green at ≥ 99%, amber at ≥ 95%, red below that.
- Intervals are a floor, not a guarantee. SpyWeb wakes up on a fixed tick (
interval = 60seconds by default injobs/uptime-monitor/config.toml), so a monitor set to 10 seconds is still only checked about once a minute unless you lower that tick. Set monitor intervals at or above the tick value. - Failures are counted consecutively per monitor; the count resets as soon as a check passes.
Enable Check Certificate on any HTTPS monitor to probe its certificate. The probe runs at most once every 24 hours per monitor, independently of the check interval, and:
- stores the expiry date and remaining days (visible in the monitor detail panel), and
- sends an alert when the certificate expires within the monitor's Cert Threshold.
A monitor's threshold of 0 (the default) inherits the instance-wide value from Settings (cert_threshold_days, default 14 days) and follows later changes to it. Any value >= 1 overrides the instance default for that monitor. Export and import keep an inherited threshold as 0, so the instance-wide value is never baked into an exported file.
For multi-node: Certificate probing only runs in central nodes not in checker nodes.
Export (Monitors page) downloads your current monitors as JSON or CSV, in the same shape the importer expects.
Import accepts a .json or .csv file. The result reports how many rows were imported, skipped (duplicate URL) and failed (missing name or URL).
See monitor.json.example:
[
  {
    "name": "My Website",
    "url": "https://example.com",
    "method": "HEAD",
    "interval_sec": 300,
    "timeout_ms": 10000
  },
  {
    "name": "Cert Monitor",
    "url": "https://example.com",
    "check_cert": 1,
    "cert_threshold_days": 14
  }
]See monitor.csv.example:
name,url,method,interval_sec,timeout_ms,check_value,desktop_notify,enabled,check_cert,cert_threshold_days
My Website,https://example.com,HEAD,300,10000,,0,1,0,14
API Health Check,https://api.example.com/health,GET,60,5000,ok,0,1,0,14
Cert Monitor,https://example.com,HEAD,3600,10000,,0,1,1,14| Column | Required | Values |
|---|---|---|
name |
yes | Any string, max 255 chars |
url |
yes | Full URL with protocol, max 2048 chars |
method |
no | HEAD, GET, POST, PUT, PATCH, DELETE (default HEAD) |
interval_sec |
no | 10 - 86400 (default 300) |
timeout_ms |
no | 1000 - 60000 (default 10000) |
check_value |
no | Text to search for in the response body (max 1000 chars) |
desktop_notify |
no | 1 = desktop notification on down, 0 = off (default 0) |
enabled |
no | 1 = enabled, 0 = disabled (default 1) |
check_cert |
no | 1 = check certificate, 0 = skip (default 0) |
cert_threshold_days |
no | 0 - 365 (default 0 = inherit instance setting) |
Exports carry one extra column, desktop_notify, which the importer also accepts, so a file you exported can be edited and re-imported as-is.
Alerts are sent to the channels assigned to a monitor. What you receive depends on the kind of state change, not on every single failed check:
| Event | When it fires | Repeats? |
|---|---|---|
| DOWN | A monitor that was up fails | Once, on the transition |
| Still DOWN | A monitor stays down | Only after 3 consecutive failures and the alert cooldown (alert_cooldown_sec, default 5 min) has passed |
| BLOCKED | A monitor starts returning 4xx |
Once, on the transition |
| UP | A down or blocked monitor recovers | Once, on the transition |
| Certificate | A certificate falls inside its threshold, or the TLS probe fails | Each probe cycle |
The cooldown exists so a flapping target doesn't flood you, while a long outage still sends reminders.
On a standalone install this is the whole story. On a central node in a cluster, monitor alerts come from the consensus result instead (see CLUSTER.md); checker nodes only alert when they lose contact with central, and only if configured to do so.
Add channels on the Notifications page. Each type needs different fields:
| Type | Required fields | Notes |
|---|---|---|
| Webhook | URL |
Sends a JSON POST (payload below) to any endpoint |
| Discord | Webhook URL |
Posts an embed, colored by severity |
| Slack | Webhook URL |
Posts a colored attachment |
| ntfy | Server URL, Topic |
Token is optional (for protected topics); defaults to https://ntfy.sh if the server URL is blank |
Provider (SendGrid), API Key, From, To |
Uses SendGrid's HTTP API with an SG.… key. This is not an SMTP relay, so there's no host/port to configure |
Each channel has a global Enabled switch. Turning a channel off silences every monitor assigned to it without deleting the assignments.
Always test a channel with the test button before relying on it.
Beyond the built-in five: the Webhook type is a general-purpose outgoing request - a plain JSON POST with a standard content-type, no special headers or handshake on the receiving end. Anything that accepts a JSON body works as-is, and anything that doesn't goes through a relay you control (n8n, Node-RED, a small script).
Want a native type instead? That is a self-hosted edit, not a missing capability: one small module that maps a channel's config and the alert onto that service's HTTP API, plus registration. The existing five are exactly this shape, nothing more special than that. Copy this as a starting point:
-- lib/notifier/pager.lua
local M = {}

function M.send(cfg, alert)
    -- cfg   = the channel's config JSON (url, token, whatever you define)
    -- alert = { monitor, url, severity, message, timestamp }
    -- severity is UP, DOWN or BLOCKED
    return http_post(cfg.url, json_encode({
        event   = alert.severity,
        monitor = alert.monitor,
        text    = alert.message,
        link    = alert.url,
        at      = alert.timestamp,
    }), {
        ["Content-Type"]  = "application/json",
        ["Authorization"] = "Bearer " .. (cfg.token or ""),
    })
end

return M
Register it in the services table in lib/notifier/init.lua and the type enum in lib/validate.lua, then add the dropdown option in dashboard/src/components/ChannelForm.vue and the label in dashboard/src/pages/Notifications.vue. The dashboard test button is the quickest sanity test.
{
  "event": "monitor_alert",
  "monitor": "My Website",
  "url": "https://example.com",
  "severity": "DOWN",
  "message": "Status changed from UP to DOWN: connection timed out",
  "timestamp": 1758451200
}
severity is one of DOWN, BLOCKED, UP. The same shape is used for test sends, and for cluster connectivity alerts (monitor is Central).
Two places produce native OS notifications:
- Per monitor, via its System Notify toggle.
- On checker nodes, for central connectivity, unless
checker_alerts.desktop = falseinconfig.lua.
Desktop notifications require a graphical session; they do nothing on a headless server.
Create pages on the Status Pages page and share the link publicly.
- Monitor page is one monitor's current status, uptime and history.
- Group page is a combined view of several monitors, with an overall status and per-monitor rows you can reorder.
- Publish a page to make it accisable publicly.
Details worth knowing:
- A monitor can have only one monitor-type page. Group pages can include any monitors, including ones that already have their own page.
- Disabled monitors are hidden from public pages entirely.
- Slugs are immutable and generated from the page name plus a short random suffix (for example
/status/api-status-x7q2m). Renaming the page does not change the link.
The Settings page controls instance-wide behavior. These keys are validated server-side:
| Setting | Range | Default | Description |
|---|---|---|---|
instance_name |
max 100 chars | UPTYME |
Name used in alert payloads and email subjects |
retention_days |
1 - 3650 | 90 |
How long check history is kept |
alert_cooldown_sec |
60 - 86400 | 300 |
Minimum time between repeat alerts for a monitor that is still down |
treat_4xx_as_down |
0 or 1 |
0 |
Count 4xx/BLOCKED responses as DOWN instead |
node_liveness_sec |
30 - 3600 | 90 |
How recently a checker must have reported to count for consensus |
consensus_min_nodes |
1 - 100 | 2 |
Part of the consensus threshold (see Consensus) |
consensus_quorum_pct |
1 - 100 | 51 |
Percentage of live nodes needed to agree |
status_page_theme |
light or dark |
light |
Default theme for public status pages |
cert_threshold_days |
1 - 365 | 14 |
Instance-wide certificate threshold; monitors with per-monitor value 0 inherit this |
status_page_slug_style |
name_random or random |
name_random |
How slugs are generated for new status pages |
status_page_random_length |
3 - 10 | 5 |
Length of the random slug suffix |
status_page_name_max_length |
5 - 50 | 20 |
Max characters of the name prefix in a slug |
These knobs live in jobs/uptime-monitor/config.toml, inside the folder you installed to:
interval = 60    # how often SpyWeb looks for due monitors (seconds)
workers = 2 # how many monitors are checked concurrentlyintervalis the Spyweb polling scheduler tick, not a monitor's check interval. Lower it if you have monitor interval < 60.workersis how many checks run at once. These are async I/O tasks, so a single executor thread multiplexes many concurrent requests.
Raising workers increases concurrency, but each in-flight response buffers up to 10 MB in memory, so don't push it higher than the check volume and RAM you actually have. There's no point having more workers than you have monitors due in a single tick.
Finally, give SpyWeb threads to match your CPU cores (default is 2):
SPYWEB_THREADS=2 ./spyweb startThe same applies under a process manager or systemd unit, set SPYWEB_THREADS in the service environment.
Docs: TOML config, concurrency settings.
Everything UPTYME knows lives in a single SQLite database at data (plus transient data-wal / data-shm files while it's running).
Retention: records older than retention_days (default 90) are deleted by a cleanup pass that runs once every day. Consensus transition history is cleaned with the same setting.
How much space history takes, per monitor:
| Interval | Retention | Records per monitor |
|---|---|---|
| 5 min | 90 days | ~25,920 |
| 1 min | 90 days | ~129,600 |
| 5 min | 365 days | ~105,120 |
| 1 min | 365 days | ~525,600 |
With 100 monitors at 1-minute intervals and 90-day retention you'd be around 12.9 million rows. SQLite handles it fine, but the file grows steadily.
Backup: stop SpyWeb, copy data and start it again. Don't copy the file while SpyWeb is running.
If
data-wal/data-shmfiles are still present after stopping SpyWeb (it did not shut down cleanly and likely crashed), copy them too.
Restore: put data (and -wal, shm if present) back in the project folder and start the service.
- Back up
data(andconfig.luaif you're running multi-node). - Replace the program files by re-running the setup script, or extract the newer release and copy its contents over your install.
Modifying the source? Track your changes in git instead of hand-editing a release install. Step 2 overwrites program files, so local edits are lost or become a manual merge on every update. Clone the repo, keep your changes in commits or a branch, and update with git pull - conflicts surface for you to resolve instead of disappearing under the new files. See Development and Customization.
SpyWeb has its own update cycle & mechanism - just run ./spyweb update or ./spyweb update -h to see the options.
Release archives also include the helper scripts (run, watch, dashboard/ sources), but those are only relevant if you're modifying UPTYME itself. See Development and Customization for more info.
UPTYME is a binary plus static files. Run it under whatever process manager you already use.
Linux: use systemd to start on boot and restart on crash. Full steps: SpyWeb deployment guide.
Docker / PM2 / supervisord: any process manager works, just run ./spyweb start.
Remote access: put it behind SSH tunnel, Nginx or Caddy. See Accessing the UI securely, and set SPYWEB_API_KEY first.
Reverse proxies: because there is no runtime or asset pipeline at request time, a simple static + proxy config is enough. Serve the root of the app and forward /api/* to SpyWeb.
UPTYME protects itself at three layers.
1. API key. Setting SPYWEB_API_KEY protects the entire admin API:
SPYWEB_API_KEY=your-undeniably-very-secure-secret ./spyweb startThe dashboard asks for this key on first load and stores it in your browser. Without it, anyone who can reach the port can create, edit and delete monitors, channels, settings, nodes and status pages. Always set it if the instance is reachable from anywhere other than your own machine, and especially before setting up a cluster, because central must be reachable by every checker.
2. Input validation. Every write request is validated before it touches the database: required fields, string lengths, numeric ranges, allowed values, and a strict key allowlist on settings. Invalid requests get a 400 naming the offending field.
3. Rate limiting. Admin and public endpoints are rate-limited separately. Exceeding a limit returns 429 Too Many Requests with Retry-After, X-RateLimit-Limit and X-RateLimit-Remaining headers. In multi-node cluster, reports are rate limited per node rather than per IP, so checkers behind the same NAT don't throttle each other.
Only needed if you're modifying the source, not just config (the dashboard, the job hooks, or the Lua backend). Regular installs never touch any of this.
- SpyWeb SQL binary in the project root (as in Option B)
- Node.js or Bun, for building the dashboard
- On Windows: WSL or Git Bash, since
runandwatchare bash scripts
git clone https://github.com/spyweb-app/uptyme
cd uptyme./run # install deps, run tests, build the dashboard, start SpyWeb
./run --no-test # skip spyweb test suite
./run --port 9000 # change the port (dev default is 8000)
./run -q # quieter SpyWeb logs (-qq for errors only)
./runserves the dashboard on port 8000, not the production default of 7979.
./watch # SpyWeb on 8000 + Vite dev server on 5173 with hot reload./watch pins SpyWeb to port 8000 because the Vite dev proxy targets it; passing --port is rejected on purpose. Open http://localhost:5173.
Or run the two halves manually:
./spyweb start --port 8000        # terminal 1
cd dashboard && npm install && npm run dev # terminal 2, http://localhost:5173./spyweb test # server/tests.lua plus each job's tests.luaOnce the database exists (start SpyWeb at least once):
./scripts/seed.sh              # sample monitors with realistic check history
./scripts/seed.sh --central # also seed consensus/node-report dataVite writes straight into ui/, which is the folder SpyWeb serves:
cd dashboard
npm run build         # production build into ../ui
npm run tc            # type-check only (vue-tsc)
or just do ./run after changing anything under dashboard/src.
uptyme/
  spyweb, spyweb-tray       # SpyWeb binaries (not in the repo; download them)
  run, watch                # dev helper scripts (bash)
  config.lua.example        # multi-node config template
  monitor.json.example      # sample import (JSON)
  monitor.csv.example       # sample import (CSV)
  dashboard/                # Vue 3 + Vite frontend source (builds into ui/)
  ui/                       # built dashboard, served by SpyWeb
  server/                   # API routes and handlers
  lib/                      # shared Lua: validation, rate limiting, cluster, notifications, database access
  jobs/                     # SpyWeb job configs and hooks
    uptime-monitor/         #   checks + alert evaluation
    cluster-sync/           #   checker <-> central sync
    db-benchmark/           #   storage benchmarking
  scripts/                  # seed.sh and its sample monitor list
  data + (-shm, -wal)       # SQLite database (created on first run)
MIT