Welcome to GraphOptima, a framework for paralleled multi-objective optimization of graph layouts. Given a set of readability metrics, the framework aims to produce layouts that are optimum given different priority of each readability metrics.
The framework supports the optimization of parameters for the cugraph.forceAtlas2 layout. To optimize other layouts,
one can create a simple Python script that takes a layout parameter and outputs a dataframe of all vertices positions,
as detailed in the FaQ.
The framework optimizes for layout crosslessness (number of edge crossings), normalized_edge_length_variance,
and min_angle (average angles between edges), with metrics measured using the GLAM library. Similar to the layout
generation process, the modular design of the framework allows users to add more readability metrics or even use
readability metrics from other libraries. For instructions on how to do this, please refer to the FaQ.
GraphOptima supports two modes of operation:
- Automatic Mode: In this mode, users need it only execute the
GraphOptima.pymaster program. It automatically configures layout generators and evaluators based on a predefined task specified in theconfig.json. Note: This mode relies on a sbatch file compatible with the Slurm Work Manager used by the Digital Research Alliance of Canada (DRAC), which may not be suitable for all HPC clusters. - Manual Mode: This mode requires users to manually initiate multiple layout generators, evaluators, and the optimizer. It offers real-time output into the workings of each module.
We strongly recommend setting up GraphOptima on top of a High-Performance Computing (HPC) cluster with GPU for maximum performance. Since the framework relies on file synchronization to pass information between nodes, the cluster should have access to a shared file system such as Lustre.
Setting up GraphOptima involves the following steps:
-
Download the GraphOptima to an HPC: Download the GraphOptima framework code from our GitHub repository to an HPC. In our tutorial, we use Graham from the Digital Research Alliance of Canada (formerly, Compute Canada). We recommend moving it to the
$SCRATCHdirectory for the maximum performance. -
Automatic Setup: run
bash GraphOptima/readability_optimization/install.sh -
Manual Setup:
-
Set Up Apptainer Virtual Container: For detailed steps, refer to Setting up cuGraph layout generators on Compute Canada's Graham Cluster Using Singularity.md and follow steps 1–4.
- Note: the
Singularityhas now been renamed toApptainer, and the steps in the tutorial works for both Singularity and Apptainer.
- Note: the
-
Create a python virtual environment: Create a virtual environment
ENVunder thereadability_optimizationdirectory using therequirements.txt. On Graham, you can do the following:module load StdEnv/2020module load python/3.11.2cd readability_optimizationvirtualenv --no-download ENVsource ENV/bin/activatepip install -r requirements.txt
NOTE: make sure after the env is created, it is on
$SCRATCH/netviz/readability_optimization/ENVdirectory.-
Generate Sample Graphs (Optional): By default, the GraphOptima will optimize a example price network stored under the
input_graphfolder as.graphml. However, if you want to generate more graphs After setting up the singularity instance, generate test graph for test optimizations. Following instructions in Use GraphML in GraphOptima.md.- For optimizing you own graphs, use
input_graphs/graph_cleaning.ipynbto pre-process the graph. Store the cleanedgraphmlfile in theinput_graphsdirectory.
- For optimizing you own graphs, use
-
Set Up GLAM Layout Evaluator: Finally, set up the GLAM layout evaluator. See steps 1–4 in Setting up GLAM layout evaluators on Compute Canada.md. After the installation, ensure that the
GLAMexecutable is in$SCRATCH/netviz/readability_optimization/glam/build/glam
-
After these steps, the framework setup is complete and ready for use.
Under the automatic mode, the Framework will automatically spawn layout generators, evaluators, and optimizer based on the config file, and revive any killed node until the optimization is complete. The user won't be able to see the output from the layout generators and evaluators under this mode.
For automatic mode, follow these steps:
-
Configure JSON File: Configure the
config.jsonfile following the instructions in How to set up the config file.md. -
Run the following commands:
cd $SCRATCH/netviz/readability_optimizationbash GraphOptima.sh
-
NOTE: the GraphOptima.py needs to be running until the optimization is complete. Thus, it is strongly recommended to hang it on a
screensession.
This script communicates with the Slurm Queue task manager to automatically allocate the designated number of layout evaluators, layout generators, and optimizers based on the config file. It will also automatically respawn any computing nodes using
SBATCH. The script needs to remain open during the entire optimization process. Thus, it is recommended to hang it on ascreensession.It is strongly recommended to enable email notification when submitting jobs through
SBATCH, so when the submission failed, one can roll back and check the error before the framework attempts to resubmit the job. To enable the email notification, add the following lines to the top of everySBATCHscript:#SBATCH --mail-user=example@mail.com#SBATCH --mail-type=begin #email when job starts#SBATCH --mail-type=end #email when job ends#SBATCH --mail-type=ALL
Under the manual mode, the user will need to manually spawn multiple screen sessions to hang on the layout generators, evaluators and the optimizer. The user will be able to see the real time output from each module.
NOTE: the manual mode is still going to read the config file for specifying input graph etc. However, it won't call the sbatch file to spawn the layout generators and evaluators automatically.
| Module | Environment | GPU Requirement | RAM Requirement | Container/Virtual Environment | Description |
|---|---|---|---|---|---|
| Optimizer | Login or computing node | No | - | Singularity | Finds the best set of parameters for the most readable layout |
| Layout Generator | Computing node | Yes (≥Tesla T4) | ≥ 16 GB | Singularity | Reads parameters set by the optimizer and generates a layout accordingly |
| Layout Evaluator | Computing node | Yes | ≥ 16 GB | Python venv | Calculates readability from the layout generated by the layout generator |
| Database Viewer (optional) | Computing node | No | ≥ 16 GB | Python venv | Allows users to view the database connected to the optimizer in real-time |
| External API Monitor (optional) | Login or computing node | No | - | Python venv | Enables framework communication via the internet, e.g., email notifications |
For manual mode, follow these steps:
NOTE: These modules have to run in parallel. It is recommended to use
screento manage multiple sessions.
-
Spawn Layout Generators:
module load apptainersalloc --ntasks=1 --mem=16G --gres=gpu:t4:1 --time=3:59:59 --account=username --job-name=layout_generatormodule load apptainercd $SCRATCH/netviz/readability_optimizationsingularity shell --nv -B /scratch singularity/netviz-graham-v10.sifbash layout_generator.sh
-
Spawn Layout Evaluators:
salloc --ntasks=1 --mem=16G --gres=gpu:t4:1 --time=3:59:59 --account=username --job-name=layout_evaluatormodule load apptainercd $SCRATCH/netviz/readability_optimizationbash layout_evaluator.sh
-
Set Up the Optimizer Node:
salloc --ntasks=1 --mem=16G --time=3:59:59 --account=username --job-name=optimizermodule load apptainercd $SCRATCH/netviz/readability_optimizationsingularity shell --nv -B /scratch singularity/netviz-graham-v10.sifbash optimizer.sh
-
Set Up the Database Viewer (Optional):
salloc --ntasks=1 --mem=16G --time=3:59:59 --account=username --job-name=database_viewercd $SCRATCH/netviz/readability_optimizationsource ENV/bin/activatepython optimization_database.py
-
Set Up the External API Monitor (Optional):
cd $SCRATCH/netviz/readability_optimizationsource ENV/bin/activatepython external_api.py
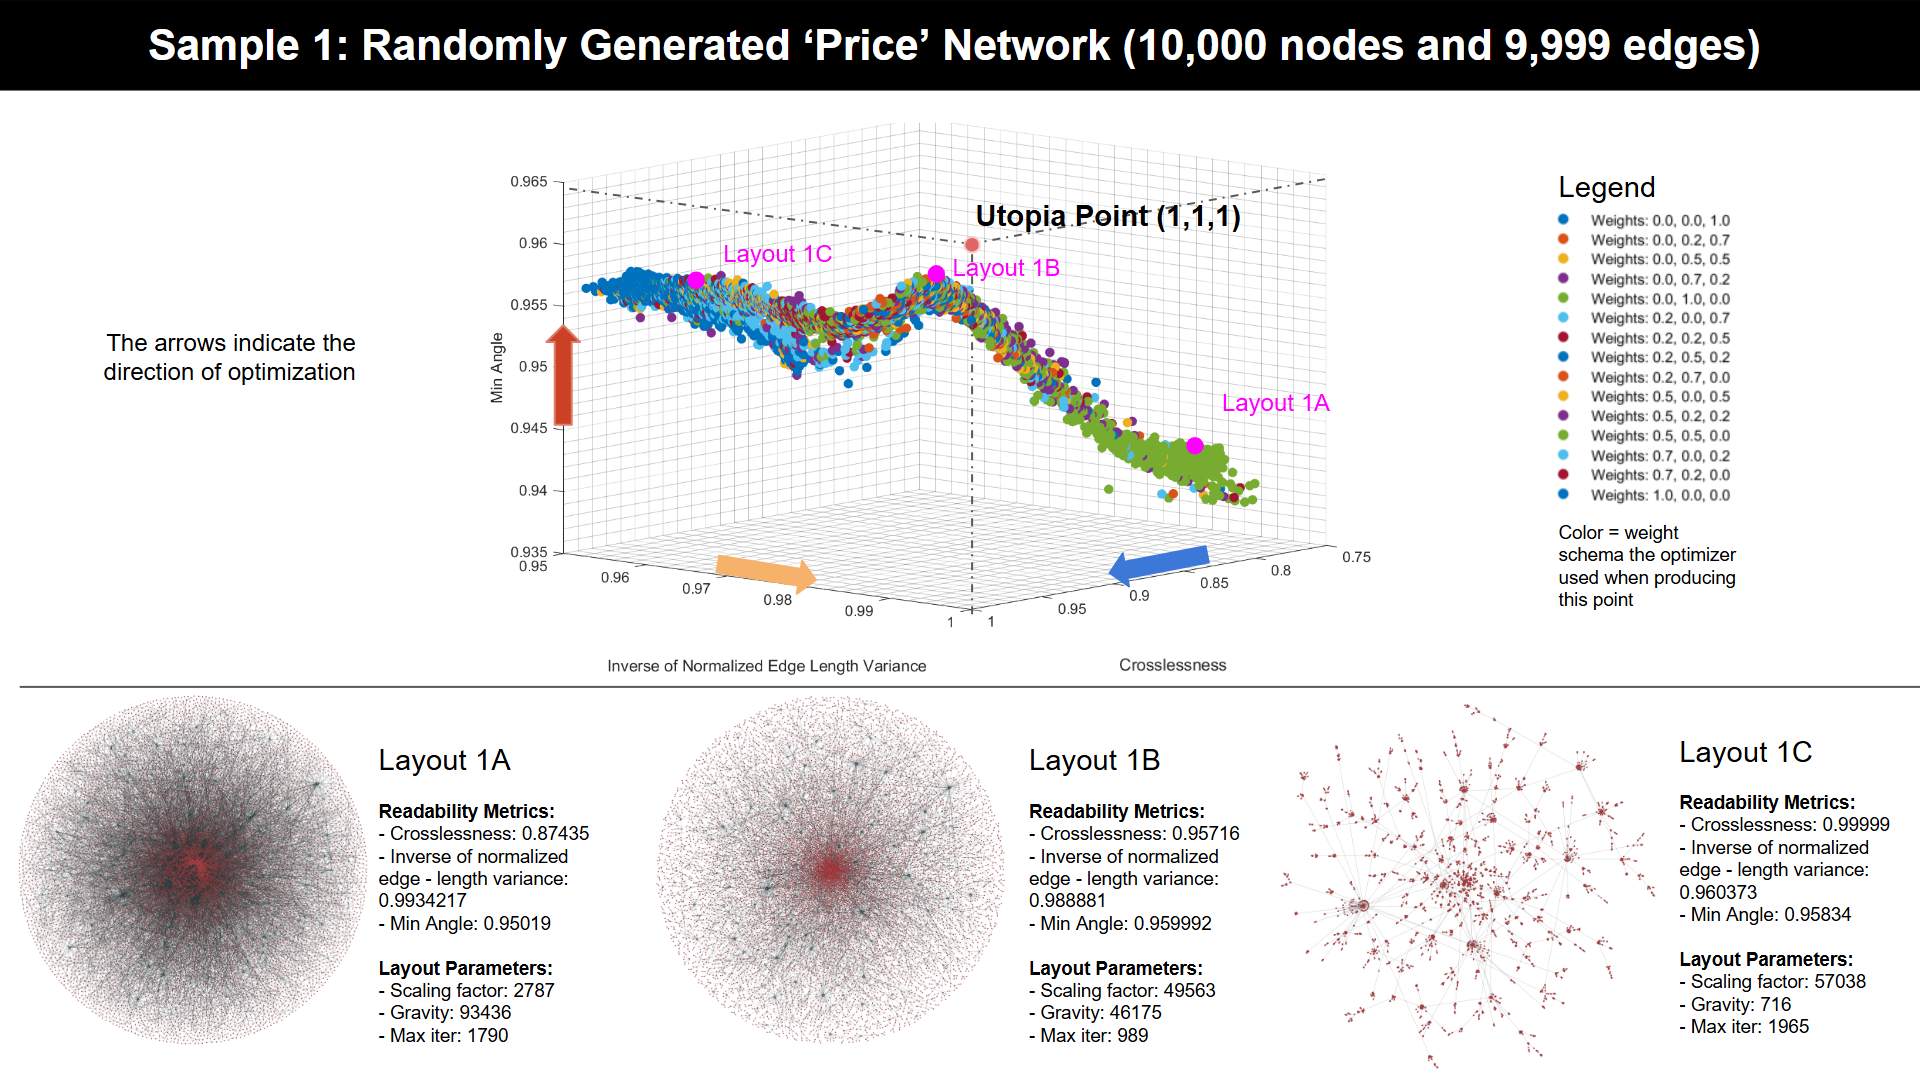
To visualize the result after optimization, as shown in the image at the beginning of this README, follow these steps:
-
After running the optimization, run
make_mat.pywith all.dbfiles generated by the optimizer stored in the/databasedirectory. Then move the.matfile to thevisulizationsfolder. -
After the
.matfile is generated, follows Collecting, Extracting, and Interpreting Optimization Results using Python and MATLAB.md to visualize the multi-objective optimization results as Pareto fronts and examine trade-offs between each readability metric. -
To visualize a given graph using RAPIDS cuGraph based on the selected layout parameters, follow instructions outlined in Using cuGraph, Singularity, and Jupyter Notebook to Reproduce and Visualize Layouts.md.
-
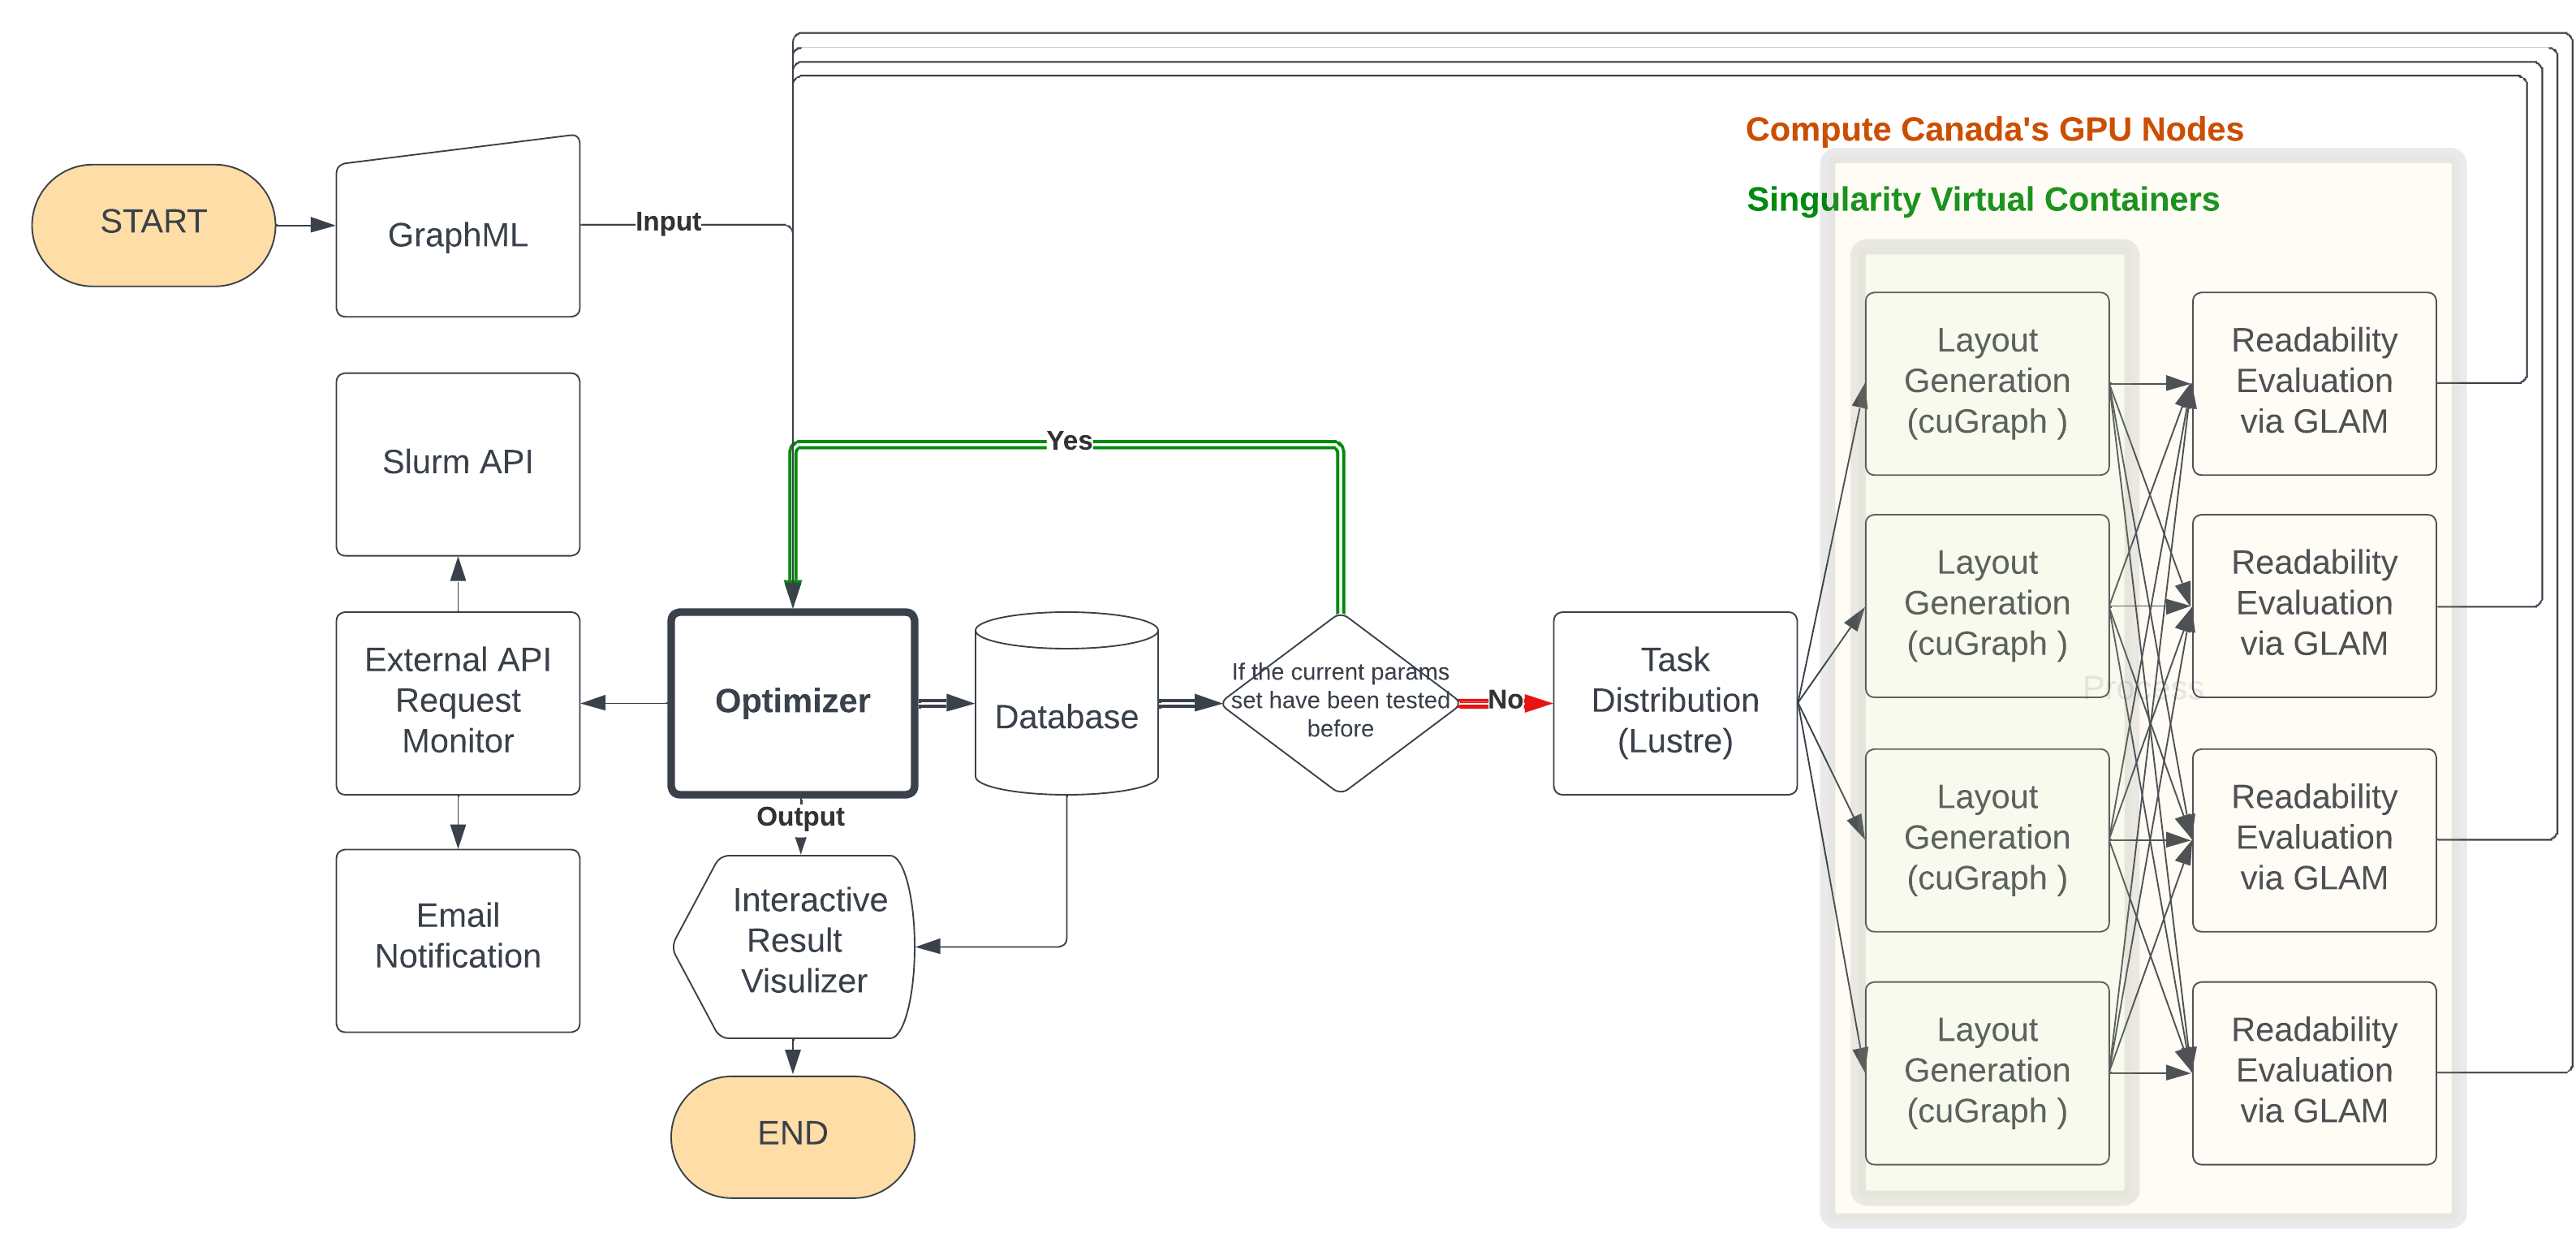
Optimizer Module: Utilizes an evolutionary algorithm to explore and propose optimal combinations of layout parameters. It applies multi-objective optimization to balance different readability metrics, like edge crossings and angle uniformity, optimizing the overall layout based on a weighted readability score.
-
Layout Generator Module: Receives parameters from the Optimizer and generates graph layouts. This module is built for parallel processing across multiple compute nodes, enabling the rapid creation of layouts using algorithms such as ForceAtlas2 from the cuGraph library. It's designed to handle an extensive range of layout algorithms and parameters, ensuring flexibility and speed.
-
Layout Evaluator Module: Assesses the generated layouts using the GLAM package for readability metrics, including crosslessness, minimum angle, and edge length variance. This module supports the integration of additional or custom readability metrics, making it adaptable to various evaluation needs.
-
High-Performance Computing (HPC) Environment: GraphOptima leverages HPC resources for scalable and efficient optimization, using distributed computing nodes for both layout generation and evaluation.
-
Task Distributor: Facilitates communication between different modules using a shared filesystem, ensuring seamless operation and data exchange within the distributed environment.
-
External API Monitor Module: Monitors the runtime of optimization jobs and manages compute resources to ensure continuous operation, including the ability to restart or spawn new compute nodes as needed.
-
Database Manager: Stores and manages the results of optimization runs, including layout parameters and readability metrics, to prevent redundant testing and enhance the efficiency of the optimization process.
-
Interactive Visualizer: Provides a graphical interface for exploring optimization results through a 3D scatter plot of the Pareto front, allowing users to visually compare and select optimal layout solutions based on their preferences.
- change the
layout_generator.shto add a new layout option with its python wrapper - add the python wrapper. The wrapper should be similar to
cuGraph_to_pos_df.pyandgt_to_pos_df.py: take a list of layout params and output a dataframe with x, y position of each node.
Currently, the layout evaluator is using GLAM. To change it to another backend or to incorporate other metrics, one can
change the dot_to_readability_score.py.
After the graph layout is generated, a corresponding dot file is generated. The dot_to_readability_score.py reads the
dot file and outputs a readability score by running subprocess calling GLAM. One just need to add their own readability
evaluation method here as a subprocess to incorporate other metrics.