
| Files | Description |
|---|---|
| Dataset | This folder houses a comprehensive collection of Netflix data sourced from Kaggle. |
| Exploratory Data Analysis | This folder encompasses the code for a Netflix data analysis project. |
| README.md | This is the Readme file of the project. |
Netflix is one of the most popular media and video streaming platforms. They have over 8000 movies or tv shows available on their platform, as of mid-2021, they have over 200M Subscribers globally. This tabular dataset consists of listings of all the movies and tv shows available on Netflix, along with details such as - cast, directors, ratings, release year, duration, etc.
The Netflix dataset is a collection of TV shows and movies available on the popular streaming platform, Netflix. The dataset contains information such as the title, director, cast, release year, country of origin, rating, and duration of each TV show or movie. The dataset is constantly updated as new content is added to the platform, and it currently includes over 5,000 TV shows and movies.
The objective of the Netflix dataset is to analyze and understand the characteristics of the content available on Netflix. The dataset can be used to uncover patterns in the types of TV shows and movies that are popular on the platform, identify trends in the content produced by different countries, and explore the relationship between ratings and other features of the content. The dataset can also be used to develop recommendation systems for users, by analyzing user preferences and matching them with relevant TV shows and movies on the platform. Overall, the Netflix dataset is a valuable resource for data analysts and researchers interested in the streaming media industry and the behavior of consumers in the digital age.
- Understanding what content is available in different countries
- Identifying similar content by matching text-based features
- Network analysis of Actors / Directors and find interesting insights
- Does Netflix has more focus on TV Shows than movies in recent years.
- Which Type of content users watches more?
- Derive sentiment of content over the years in Netflix.
-
This visual showcases the trend of content production on Netflix over a specific timeframe. It illustrates how the volume of content released on the platform has changed over the years, offering insights into the growth and expansion of Netflix's library.
df1 = df[['type','release_year']]df1=df1.groupby(['type','release_year']).size().reset_index(name='count')df1=df1[df1['release_year']>=2010]fig3 = px.line(df1, x="release_year", y="count", color='type',title='Trend of content produced over the years on Netflix') pyo.iplot(fig3)

-
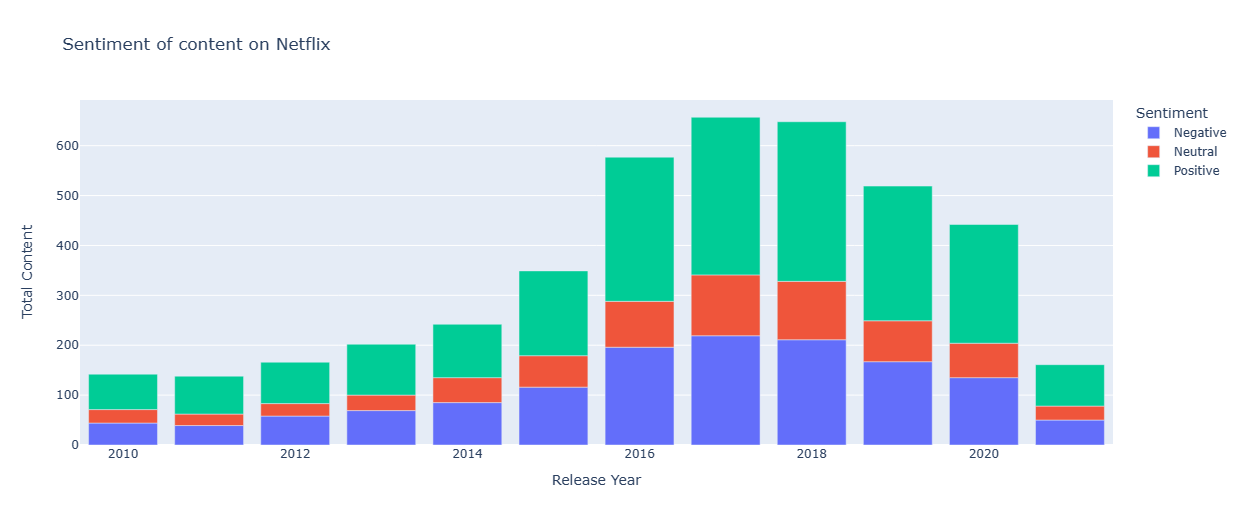
This visual presents a sentiment analysis of the content available on Netflix. It provides an overview of the overall sentiment associated with the shows and movies offered on the platform. By analyzing and categorizing the sentiment as positive, negative, or neutral, this visual offers valuable insights into the general emotional tone and reception of Netflix's content. It enables users to understand the prevailing sentiments surrounding the content and gain a better understanding of audience preferences and reactions.
dfx=df[['release_year','description']]dfx=dfx.rename(columns={'release_year':'Release Year'})for index,row in dfx.iterrows(): z=row['description'] testimonial=TextBlob(z) p=testimonial.sentiment.polarity if p==0: sent='Neutral' elif p>0: sent='Positive' else: sent='Negative'dfx.loc[[index],'Sentiment']=sentdfx=dfx.groupby(['Release Year','Sentiment']).size().reset_index(name='Total Content')dfx=dfx[dfx['Release Year']>=2010]fig4 = px.bar(dfx, x="Release Year", y="Total Content", color="Sentiment", title="Sentiment of content on Netflix") pyo.iplot(fig4)
-
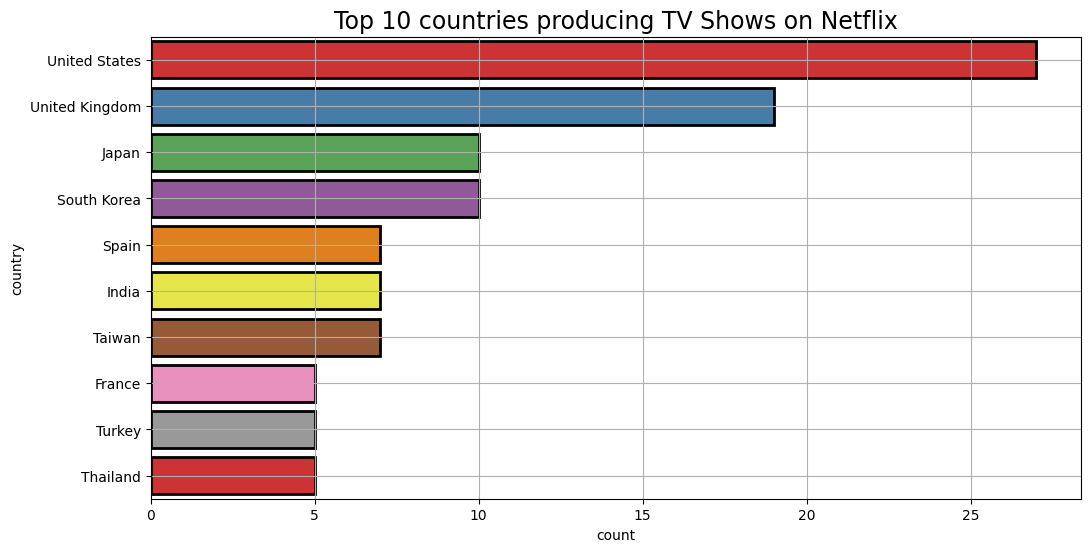
This visual presents a countplot showcasing the top 10 countries that produce the most number of TV shows available on Netflix. It offers a clear representation of the frequency or count of TV shows originating from each country within the dataset. By highlighting the countries with the highest production volume, this visual provides insights into the geographic distribution and dominance of TV show content on the platform.
# Countplot of top 10 countries prodcing most number of TV Shows on the Netflix.plt.figure(figsize=(12,6))sns.countplot(y='country',order=tv_show_countries['country'].value_counts().index[0:10],data=tv_show_countries,ec='black',lw=2,palette = "Set1")plt.title('Top 10 countries producing TV Shows on Netflix',fontsize=17)plt.grid(True)plt.show()
Netflix produces more number of Movies as compared to TV Shows.
United States produces most number of content on the Netflix, followed by India.
United States produces most number of Movies on the Netflix, followed by India.
United States produces most number of TV Shows on the Netflix, followed by United Kingdom.
Most of the content on the Netflix have rating TV-MA and TV-14.
Netflix has released most number of content around 2020 ever in the history of the Netflix.
The Category of the most of the content produces by Netflix are Dramas, International Movies and Documentaries.
Rajiv Chilaka has directed most number of content on the netflix.
David Attenborough has cast most number of shows on the Netflix.
Most of the shows on the Netflix has 1 season duration.
United Kingdom, Japan and South Korea produces more TV Shows in their countries as comapred to Movies on Netfix.
Before year 2000 the production of Movies and TV Shows are same, but after year 2000 there is a huge growth in the production fo the Movies as compared to the TV Shows of the Netflix, but after 2020 the production of both of them is almost same.