Regression 3d_slicer #261
Description
I think this is a regression. I remember this issue existed before, and I did fix it (pre 0.6.0). However, I cannot find it now.
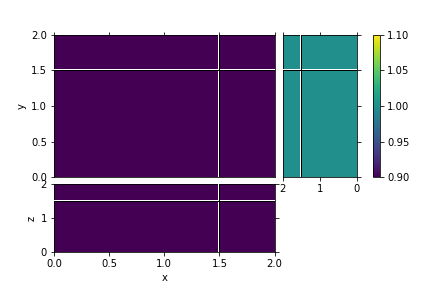
Issue: if you plot a fullspace, the z-y-plot has a different colorscale.
import discretize
import numpy as np
mesh = discretize.TensorMesh(([1, 1], [1, 1], [1, 1]), (0, 0, 0))
mesh.plot_3d_slicer(np.ones(mesh.n_cells))