A simple demonstration of charting data from DSE/Cassandra tables generated by a Spark streaming data source. Visualised using a d3 dashboard using a ReST json API, collecting data from DSE using the DataStax Nodejs driver.
This demo queries two Cassandra tables and displays the data visually:
- a sysem table (compaction history)
- a custom table containing time series data generated by this Spark Streaming example here https://github.com/simonambridge/SparkSensorData
You can change the simplechart.html file to query and display data from a different table if you wish. If you do this you will also need to edit app.js to change the ReST API query for your table.
$ sudo curl -sL https://deb.nodesource.com/setup_7.x | sudo bash -
$ sudo apt-get install nodejs
$ npm install pug
$ npm install cassandra-driver
$ mkdir test
$ cd test
$ npm init
$ npm install express --save
$ npm install connect serve-static
$ sudo npm install express-generator -g
The default server definition file is app.js - this displays a simple Hello message:
$ vi app.js

var express = require('express');
var app = express();

app.get('/', function (req, res) {
  res.send('Hello World!');
});

app.listen(3000, function () {
  console.log('Example app listening on port 3000!');
});
Start the simple node server app:
$ node app.js
Example app listening on port 3000!
In your browser go to http://127.0.0.1:3000/
The browser displays:
HelloWorld!
Kill the server (press ^C).
If you simply want to serve static content (e.g. HTML files) you could try this:
$ node server - runs server.js file
This provides a simple server on port 8000 e.g. http://localhost:8000/chartdse/public/index.html
The server.js file is very simple:
var connect = require('connect');
var serveStatic = require('serve-static');
connect().use(serveStatic(__dirname)).listen(8000);
if no start script is in package .json it will default to this server.js
See also http://expressjs.com/en/starter/basic-routing.html
Now let's create a proper node application.
From a parent directory create a new project and directory:
$ express chartdse

   create : chartdse
   create : chartdse/package.json
   create : chartdse/app.js
   create : chartdse/public
   create : chartdse/routes
   create : chartdse/routes/index.js
   create : chartdse/routes/users.js
   create : chartdse/views
   create : chartdse/views/index.jade
   create : chartdse/views/layout.jade
   create : chartdse/views/error.jade
   create : chartdse/bin
   create : chartdse/bin/www
   create : chartdse/public/javascripts
   create : chartdse/public/images
   create : chartdse/public/stylesheets
   create : chartdse/public/stylesheets/style.css

   install dependencies:
     $ cd chartdse && npm install

   run the app:
     $ DEBUG=chartdse:* npm start
Go into the directory that was created.
$ cd ../chartdse
Install local package dependencies:
$ npm install
Run this command to start the node server:
DEBUG=chartdse:* npm start
Server process output:
> chartdse@0.0.0 start /root/chartdse
> node ./bin/www
  chartdse:server Listening on port 3000 +0ms

GET / 200 364.402 ms - 170
GET /stylesheets/style.css 200 5.804 ms - 111
Go to http://127.0.0.1:3000/
The browser displays:
Express

Welcome to Express
Our Express app is now up and running!
Now from the parent directory clone the repo contents into the project directory:
$ git clone http://gitchub.com/simonambridge/chartDSE
This will overlay the repo files into the directory structure created by Express.
- app.js - defines the environment - server, port, paths etc. maps the /public directory for static content, defines the paths to the ReST interfaces and the Cassandra query code. -- package.json contains the 'start script' element pointing to "./bin/www"
- ./bin/www" - starts the http server
- If an index.html file is in ./public then it will display that as the entry point e.g. http://localhost:3000
- If not then it will use index.jade in /views and display the Express welcome message
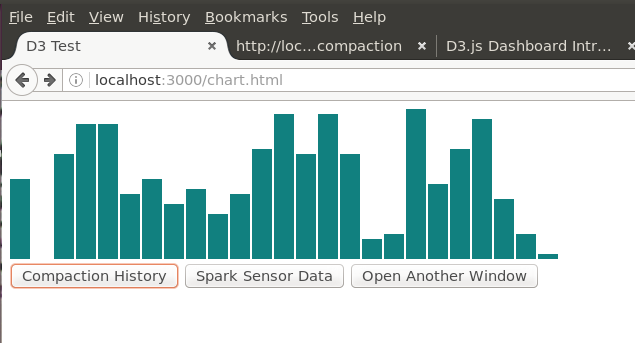
- ./public/chart.html - a simple d3 example chart and buttons to test the ReST interfaces for the two table queries
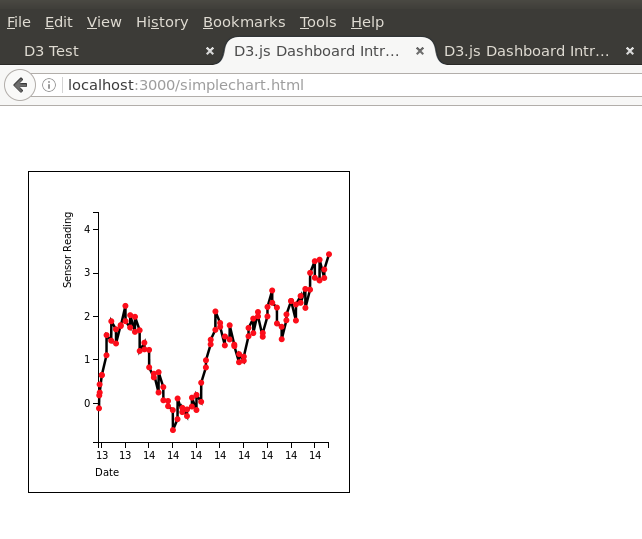
- ./public/simplechart.html - a simple dashboard that displays time-series data from the custom table - from ideas at https://github.com/ESeufert/d3.js-dashboard-examples
- ./public/multichart.html - a simple demo with multiple charts
A simple example of using the Nodejs Cassandra connector:
var cassandra = require('cassandra-driver');
var client = new cassandra.Client({ contactPoints: ['localhost']});

client.execute('select key from system.local', function(err, result) {
  if (err) throw err;
  console.log(result.rows[0]);
});
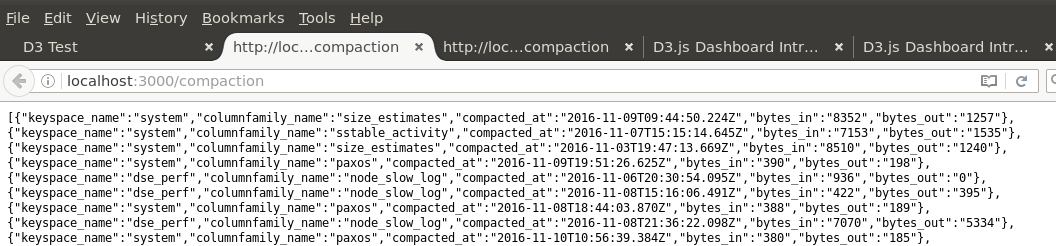
For the first ReST API we will use the system.compaction_history table:
system.compaction_history (
    id uuid PRIMARY KEY,
    bytes_in bigint,
    bytes_out bigint,
    columnfamily_name text,
    compacted_at timestamp,
    keyspace_name text,
    rows_merged map
This is the query:
select keyspace_name, columnfamily_name, compacted_at, bytes_in, bytes_out from system.compaction_history
The second table looks like this:
CREATE TABLE sparksensordata.sensordata (
    name text,
    time timestamp,
    value double,
    PRIMARY KEY ((name, time))
)
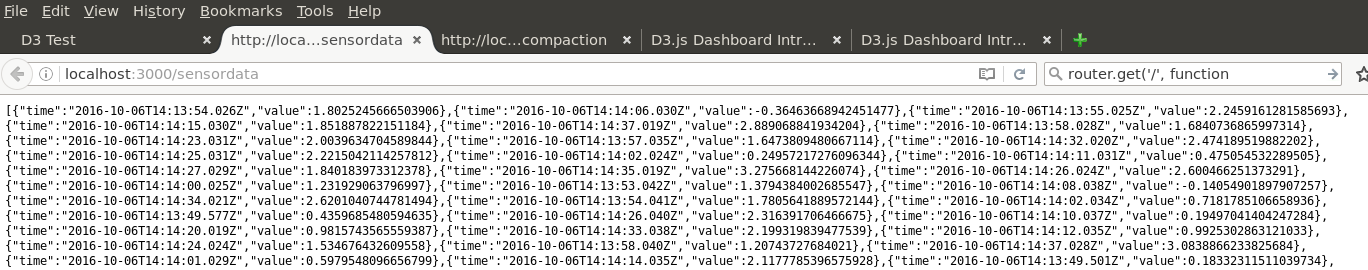
And we use this query:
select time, value from sparksensordata.sensordata
The rest interfaces are served from routes defined in app.js e.g.
app.get('/compaction', function(req, res) {
  var client = new cassandra.Client({ contactPoints: ['localhost'] , keyspace: 'system'});
  var queryString = 'select keyspace_name, columnfamily_name, compacted_at, bytes_in, bytes_out from system.compaction_history';
  client.execute(queryString, function(err, result)
  {
    if (err) throw err;
    for (var item in result.rows) {
      console.log(result.rows[item]);
    }
    res.setHeader('Content-Type', 'application/json');
    jsonString=JSON.stringify(result.rows);
    console.log('JSON = ',jsonString);
    res.send(JSON.stringify(result.rows));
  });
});
Now we know where everything is and what we're looking for, let's test it. If the server isn't currently running, go to your project directory and run this command to start the node server:
DEBUG=chartdse:* npm start
Test the system.compaction_history interface - json data is returned:
Test the custom sparksensordata.sensordata interface - json data is returned:
These are HTML pages that call the ReST interfaces and contain scripts to build d3 charts to display the data. These are in ./public
This contains a simple demo to build a bar chart, plus links to the ReST interfaces for the two tables. There is also a button showing how to link to another static HTML page.
This takes the sensor data in the sparksensordata.sensordata table and displays it in a time series line graph.
By default the d3 scripts are downloaded at runtime using a link at the top of the html page that will run your javascript (for example in simplechart.html) e.g.:
<script src="http://d3js.org/d3.v2.js"></script>
If you do not want to be dependent on an internet connection in order to run your code you can download d3 and use it locally.
Follow these steps:
Go to the d3 site at http://d3js.org Create a directory in your project directory (or centrally if you want to share between projects).
$ cd <my project directory>
$ mkdir d3
Download the entire d3 zip file from https://github.com/mbostock/d3/releases and unzip in to the d3 directory created above, or copy just the main d3 v3 js from here http://d3js.org/d3.v3.js to the d3 dir created above.
In your chart HTML file Replace
<script src="http://d3js.org/d3.v2.js"></script>
with
<script src="d3.v3.js"></script>
You can install jquery locally to remove the dependency on an internet connection.
$ npm install jqueryui
chartdse@0.0.0 /u02/dev/dse_dev/chartdse
└── jqueryui@1.11.1
$ npm install jquery
chartdse@0.0.0 /u02/dev/dse_dev/chartdse
└── jquery@3.1.1
In your chart HTML file: Replace
<script type="text/javascript" src="https://ajax.googleapis.com/ajax/libs/jquery/1.7.2/jquery.min.js"></script>
with
<script type="text/javascript" src="jquery.min.js"></script>
Replace
<script type="text/javascript" src="https://ajax.googleapis.com/ajax/libs/jqueryui/1.8.21/jquery-ui.min.js"></script>
with
<script type="text/javascript" src="jquery-ui.min.js"></script>
Copy these files from their downloads into the public directory so that we can serve them locally:
$ cp node_modules/jquery/dist/jquery.min.js public
$ cp node_modules/jqueryui/jquery-ui.min.js public
$ cp d3/d3.v3.js public
Your HTML file header was like this:
<script src="http://d3js.org/d3.v2.js"></script>
<script type="text/javascript" src="https://ajax.googleapis.com/ajax/libs/jquery/1.7.2/jquery.min.js"></script>
<script type="text/javascript" src="https://ajax.googleapis.com/ajax/libs/jqueryui/1.8.21/jquery-ui.min.js"></script>
Now like this:
<script src="d3.v3.js"></script>
<script type="text/javascript" src="jquery.min.js"></script>
<script type="text/javascript" src="jquery-ui.min.js"></script>