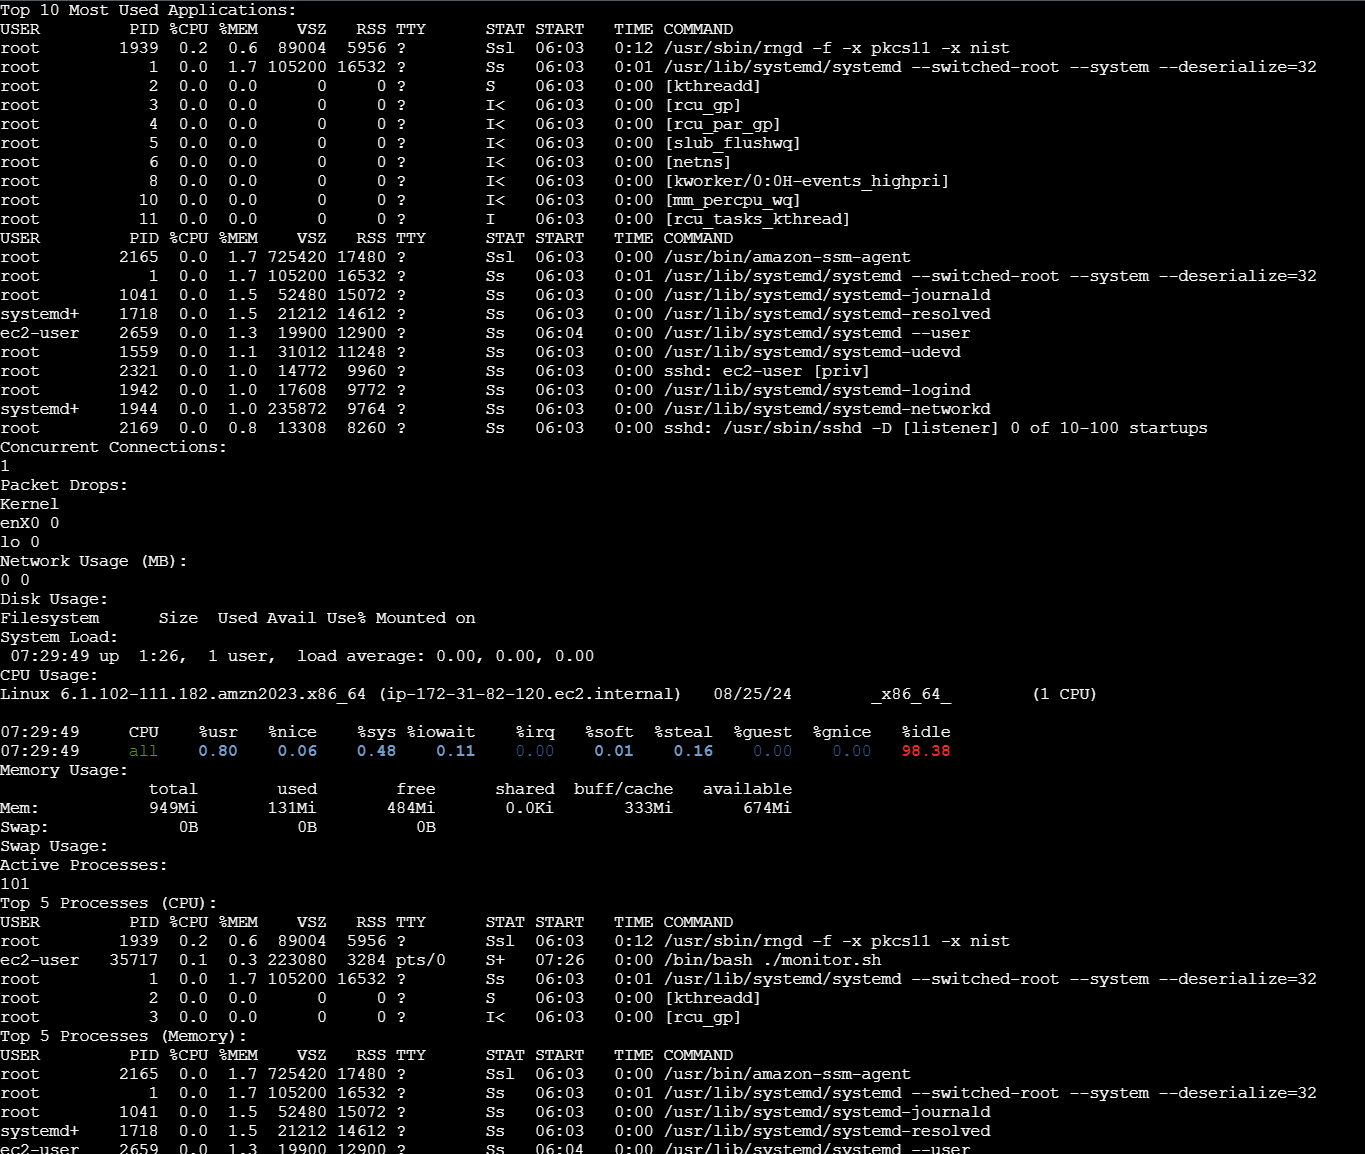
This repository contains a Bash script designed to monitor various system resources and present them in a dashboard format. The script refreshes the data every few seconds, providing real-time insights into the system's performance. Additionally, users can call specific parts of the dashboard individually using command-line switches for focused monitoring.
- Top 10 Most Used Applications Displays the top 10 applications consuming the most CPU and memory resources.
- Network Monitoring Shows the number of concurrent connections to the server. Displays the number of packet drops. Provides network usage in terms of MB in and out.
- Disk Usage Monitors disk space usage by mounted partitions. Highlights partitions that are using more than 80% of their capacity.
- System Load Shows the current load average for the system. Includes a detailed breakdown of CPU usage (user, system, idle, etc.).
- Memory Usage Displays total, used, and free memory. Provides information on swap memory usage.
- Process Monitoring Shows the number of active processes. Lists the top 5 processes in terms of CPU and memory usage.
- Service Monitoring Monitors the status of essential services like sshd, nginx/apache, iptables, and more.
- Custom Dashboard Allows users to view specific parts of the dashboard using command-line switches, e.g., -cpu, -memory, -network, etc.
-
Open amazon console , create a EC2 instance (test1),connect it
-
check ssfile
-
Install git
sudo yum install git -y
- Now create a new directory for our project and navigate to that folder
mkdir monitoring-dashboard
cd monitoring-dashboard
- Initialize Git
git init
- Create a README.md:
touch README.md
- To edit the README.md file
vi README.md - add description
press insert to add - TO save the file
ESC:wqFor example i have added a small descriptioncat README.mdto view file
check ssfile
- Create a .gitignore File , to exclude unnecessary files
touch .gitignore
- Create a bash script file :
touch monitor.sh
- Edit the script file
#!/bin/bash

# Top 10 Most Used Applications
function top_apps() {
    echo "Top 10 Most Used Applications:"
    ps aux --sort=-%cpu | head -n 11
    ps aux --sort=-%mem | head -n 11
}

# Network Monitoring
function network_monitor() {
    echo "Concurrent Connections:"
    netstat -an | grep ESTABLISHED | wc -l
    echo "Packet Drops:"
    netstat -i | grep -v 'Iface' | awk '{print $1, $4}'
    echo "Network Usage:"
    ifstat -t 1 1 | tail -n 1
}

# Disk Usage
function disk_usage() {
    echo "Disk Usage:"
    df -h | awk '$5 > 80'
}

# System Load
function system_load() {
    echo "System Load:"
    uptime
    echo "CPU Usage:"
    mpstat
}

# Memory Usage
function memory_usage() {
    echo "Memory Usage:"
    free -h
    echo "Swap Usage:"
    swapon --show
}

# Process Monitoring
function process_monitor() {
    echo "Active Processes:"
    ps aux | wc -l
    echo "Top 5 Processes:"
    ps aux --sort=-%cpu | head -n 6
}

# Service Monitoring
function service_monitor() {
    echo "Service Monitoring:"
    for service in sshd nginx iptables; do
        systemctl is-active --quiet $service && echo "$service is running" || echo "$service is not running"
    done
}

# Command-Line Switches
while getopts ":cpu:memory:network:disk:process:service" opt; do
    case $opt in
        cpu)
            system_load
            ;;
        memory)
            memory_usage
            ;;
        network)
            network_monitor
            ;;
        disk)
            disk_usage
            ;;
        process)
            process_monitor
            ;;
        service)
            service_monitor
            ;;
        \?)
            echo "Invalid option: -$OPTARG" >&2
            ;;
    esac
done

# Loop for Real-Time Updates
while true; do
    clear
    top_apps
    network_monitor
    disk_usage
    system_load
    memory_usage
    process_monitor
    service_monitor
    sleep 5
done
- To make the Code Executable
chmod +x monitor.sh
- Run the Script:
- Execute the script to ensure it works:
./monitor.sh
- Test each command-line switch individually to verify they display the correct information.
./monitor.sh -cpu
./monitor.sh -memory
./monitor.sh -network
./monitor.sh -disk
./monitor.sh -process
./monitor.sh -service

