++++++ multi sectoral energy system of Germany/Europe ++++++ dispatch optimisation ++++++ highly configurable and adaptable ++++++ multiple analyses functions +++++
The following README gives you a brief overview about deflex. Read the full documentation for all information.
To run deflex you have to install the Python package and a solver:
- deflex is available on PyPi and can be
installed using
pip install deflex. - an LP-solver is needed such as CBC (default), GLPK, Gurobi*, Cplex*
- for some extra functions additional packages and are needed
* Proprietary solver
- Run
pip install deflex[example]to get all dependencies. - Create a local directory (e.g. /home/user/deflex_examples).
- Browse the examples for deflex v0.4.x or download all examples as zip file and copy/extract them to your local directory.
- Read the comments of each example, execute it and modify it to your needs. Do not forget to set a local path in the examples if needed.
- In parallel you should read the
usage guideof the documentation to get the full picture.
The example scripts will download the example scenarios to the $HOME/deflex folder. It is also possible to browse the example scenarios.
We are warmly welcoming all who want to contribute to the deflex library. This includes the following actions:
- Write bug reports or comments
- Improve the documentation (including typos, grammar)
- Add features improve the code (open an issue first)
Go to the Zenodo page of deflex to find the DOI of your version. To cite all deflex versions use:
The following figures will give you a brief impression about deflex.
Figure 1: Use one of the include regions sets or create your own one. You can also include other European countries.
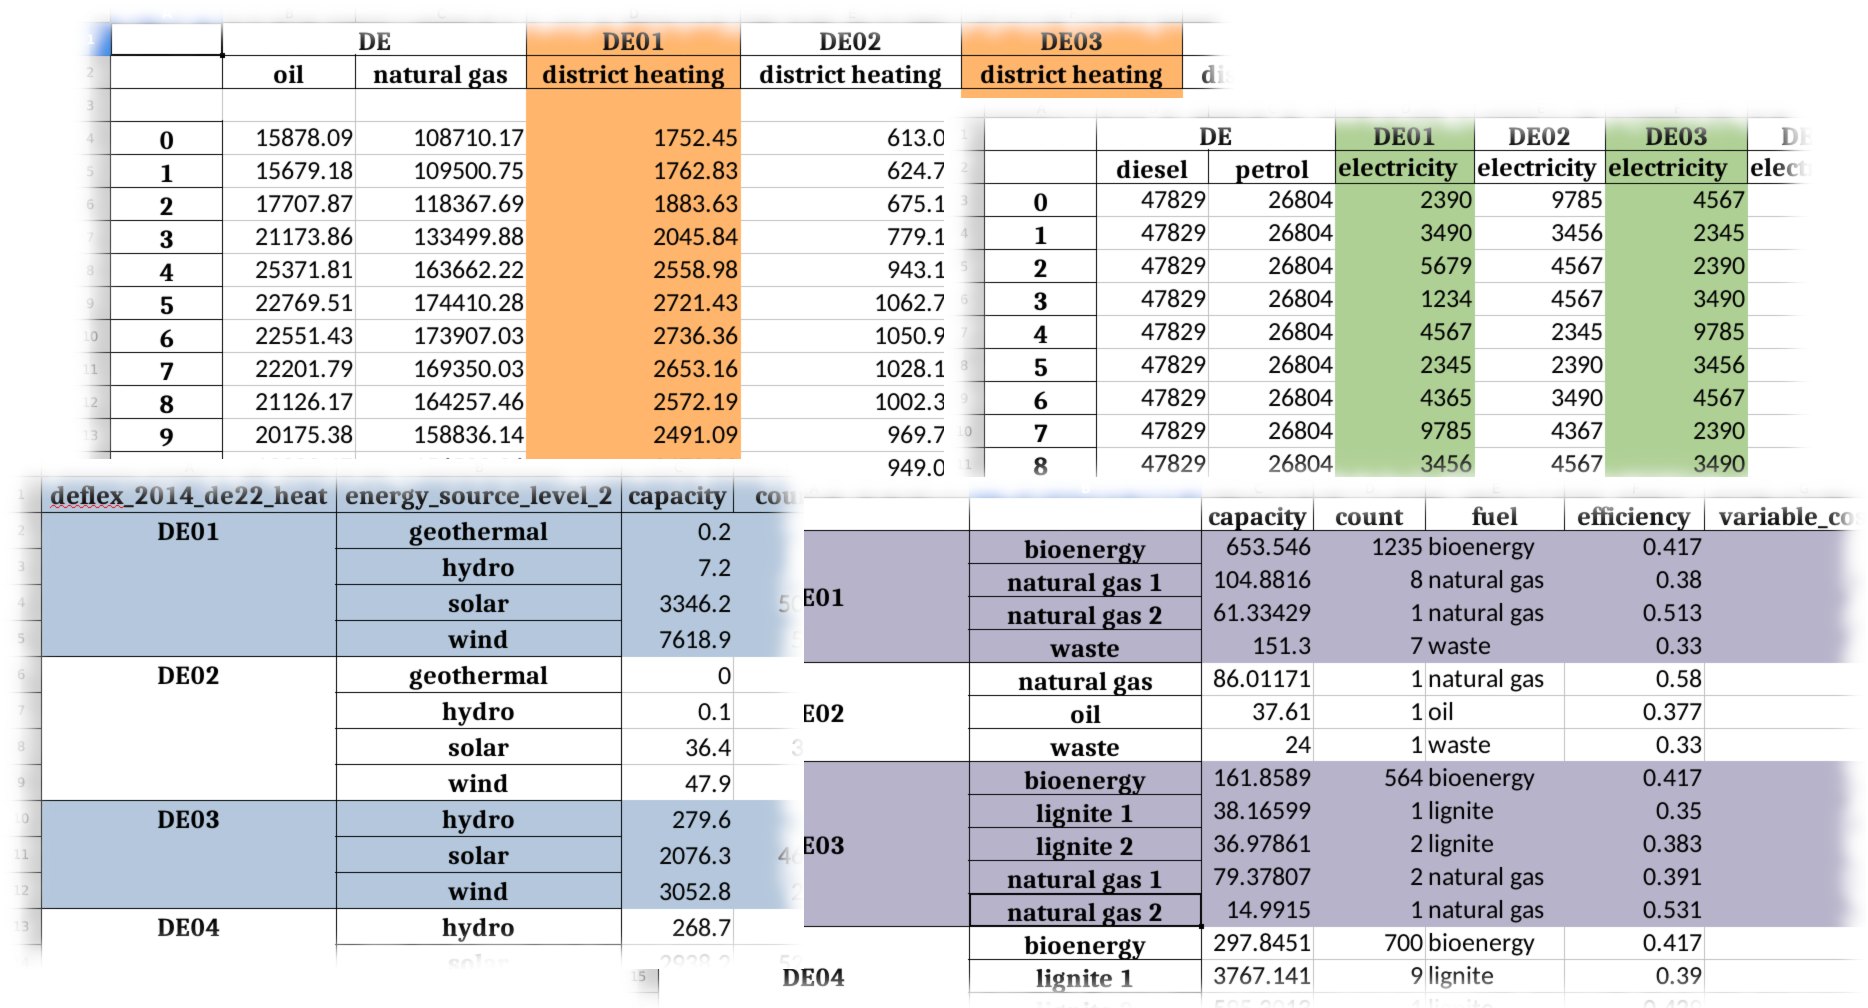
Figure 2: The input data can be organised in spreadsheets or csv files.
Figure 3: The resulting system costs of deflex have been compared with the day-ahead prices from the Entso-e downloaded from Open Power System Data. The plot shows three different periods of the year.
Figure 4: It is also possible to get a time series of the average emissions. Furthermore, it shows the emissions of the most expensive power plant which would be replaced by an additional feed-in.
Figure 5: The following plot shows fraction of the time on which the utilisation of the power lines between the regions is more than 90% of its maximum capacity:
The full documentation of deflex is available on readthedocs.
Go to the download page to download different versions and formats (pdf, html, epub) of the documentation.
Copyright (c) 2016-2021 Uwe Krien
Permission is hereby granted, free of charge, to any person obtaining a copy of this software and associated documentation files (the "Software"), to deal in the Software without restriction, including without limitation the rights to use, copy, modify, merge, publish, distribute, sublicense, and/or sell copies of the Software, and to permit persons to whom the Software is furnished to do so, subject to the following conditions:
The above copyright notice and this permission notice shall be included in all copies or substantial portions of the Software.
THE SOFTWARE IS PROVIDED "AS IS", WITHOUT WARRANTY OF ANY KIND, EXPRESS OR IMPLIED, INCLUDING BUT NOT LIMITED TO THE WARRANTIES OF MERCHANTABILITY, FITNESS FOR A PARTICULAR PURPOSE AND NONINFRINGEMENT. IN NO EVENT SHALL THE AUTHORS OR COPYRIGHT HOLDERS BE LIABLE FOR ANY CLAIM, DAMAGES OR OTHER LIABILITY, WHETHER IN AN ACTION OF CONTRACT, TORT OR OTHERWISE, ARISING FROM, OUT OF OR IN CONNECTION WITH THE SOFTWARE OR THE USE OR OTHER DEALINGS IN THE SOFTWARE.


