Open
Conversation
enable boolean type in to_arrow()

WIP: use typed array copy for arrow bool
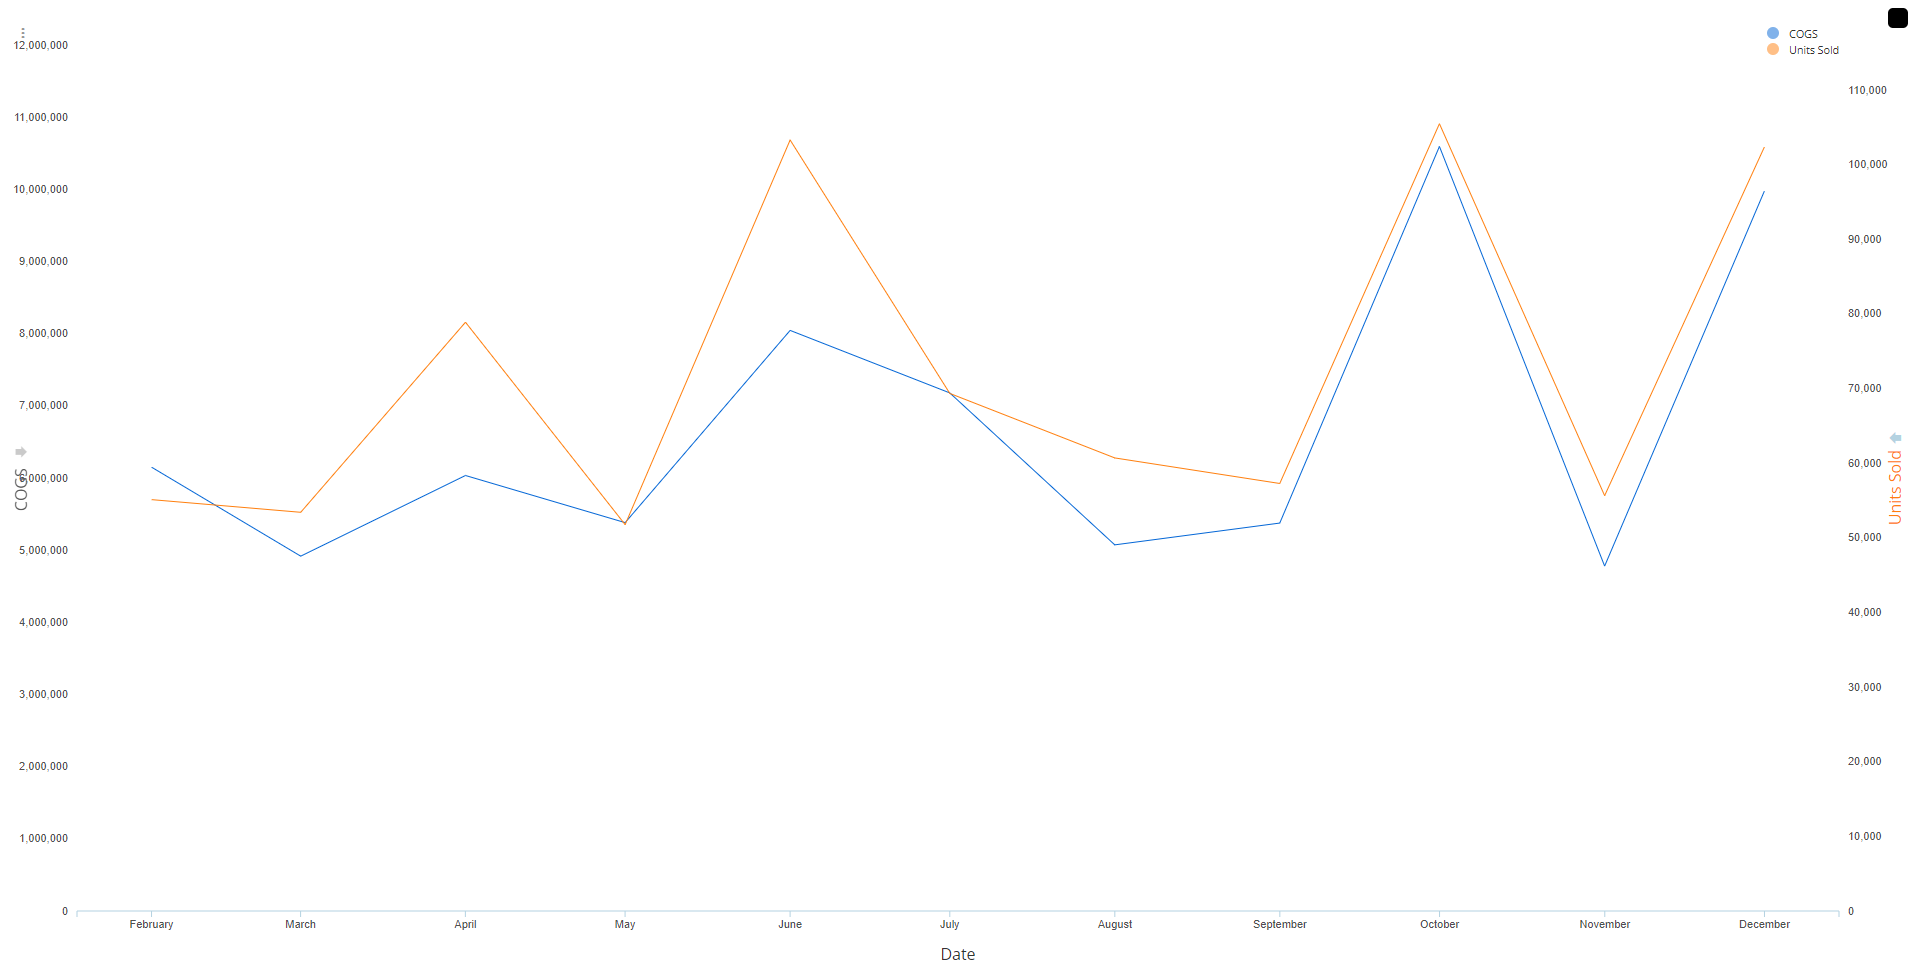
Uses a decorated chart to fill in the 5th grid column with a second y-axis, and render both sets of series with their corresponding scales.
Splitting by name is necessary when we have a split-by value, because there are multiple series per mainValue, and we can't identify them by index.

Color is applied when there isn't a split-by, but can't be when there is because there are several colours.
The Zoomable component was replacing the decorator function, so we need to chain them
0f6ac23 to
816ee7c
Compare
mhooper-scottlogic
approved these changes
May 7, 2019
Collaborator
 mhooper-scottlogic
left a comment
mhooper-scottlogic
left a comment
There was a problem hiding this comment.
Looks really good.
…nto feature/dual-y-axis
Correctly read and generate boolean values for Arrow format
Overwrite test results
Update results.json to reflect Scatter name change
use fade transition, using pre-existing map to define positioning.
… by disabling user input
…that were causing console errors
…eemap

D3 Treemaps
…ature/dual-y-axis
…feature/treemap_enhancements
…into feature/treemap_enhancements
JupyterLab enhancements
Refactor Javascript API +add documentation
…umber_formats

Fix the format of long numbers
…p_enhancements

Feature/treemap enhancements
Performance overhaul for `table.update()`
Fixed grid styling
This file contains hidden or bidirectional Unicode text that may be interpreted or compiled differently than what appears below. To review, open the file in an editor that reveals hidden Unicode characters.
Learn more about bidirectional Unicode characters
Sign up for free
to join this conversation on GitHub.
Already have an account?
Sign in to comment
6 participants
Add this suggestion to a batch that can be applied as a single commit.This suggestion is invalid because no changes were made to the code.Suggestions cannot be applied while the pull request is closed.Suggestions cannot be applied while viewing a subset of changes.Only one suggestion per line can be applied in a batch.Add this suggestion to a batch that can be applied as a single commit.Applying suggestions on deleted lines is not supported.You must change the existing code in this line in order to create a valid suggestion.Outdated suggestions cannot be applied.This suggestion has been applied or marked resolved.Suggestions cannot be applied from pending reviews.Suggestions cannot be applied on multi-line comments.Suggestions cannot be applied while the pull request is queued to merge.Suggestion cannot be applied right now. Please check back later.
Uses a decorated chart to fill in the 5th grid column with a second y-axis, and render both sets of series with their corresponding scales.