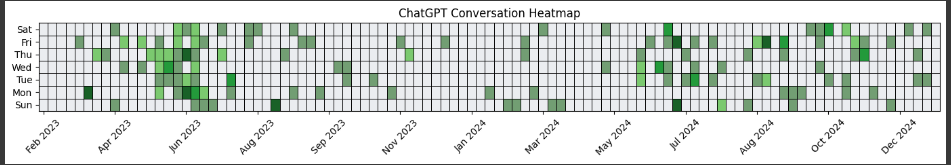
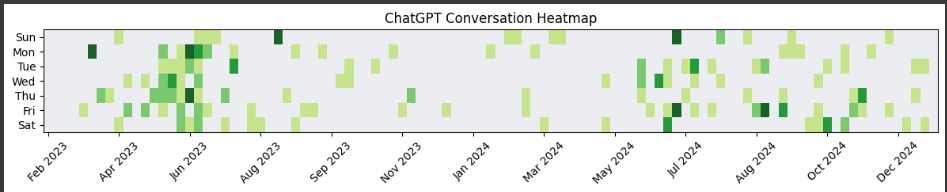
This project visualizes daily ChatGPT activity as a GitHub-style contribution heatmap, showing the number of conversations per day.
The original version of ai-heatmap is from author Chip Huyen(@chiphuyen) and the repo aie-book (every AI engineer building real-world applications should read this book).
- Converts exported ChatGPT conversation data into a heatmap.
- Displays activity counts by day, similar to GitHub contribution graphs.
Before you begin, ensure you have the following installed:
Python 3.8+matplotlibnumpy
- Visit your ChatGPT account settings.
- Navigate to Data Controls.
- Click Export Data and follow the instructions.
- You will receive a
.zipfile in your email. Download and extract it. - Locate the
conversations.jsonfile from the extracted data.
- Visit your Claude account settings.
- Click Export Data and follow the instructions.
- You will receive a
.zipfile in your email. Download and extract it. - Locate the
conversations.jsonfile from the extracted data.
-
Open the Jupyter Notebook:
jupyter notebook
-
Load the
chatgpt_heatmap.ipynbfile. -
Update the
json_file_pathvariable with the path to yourconversations.jsonfile:json_file_path = "path_to_your_conversations.json"
-
Run all cells to generate the heatmap.
- Color Map: Modify the
ListedColormapin the script to adjust heatmap colors. - Borders: Adjust
edgecolorsandlinewidthsin thepcolormeshfunction.
You can do the same for Claude, as both have the file named conversations.json.