Closed
Description
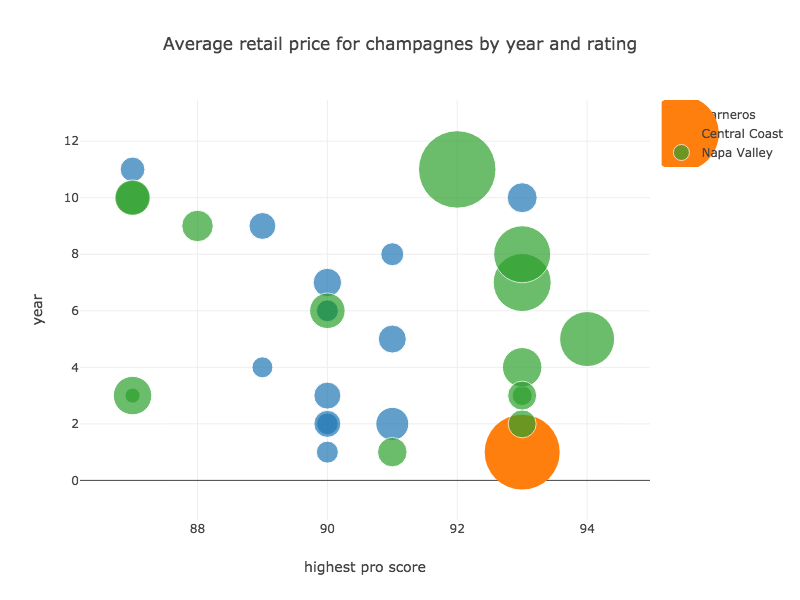
The size of one of the points associated with the scale is too large. It seems to be rendering at the same size as the value it represents. This is the only category that has a single value, which may be a factor.
The code is here.
<html>
<head>
    <script src="https://cdn.plot.ly/plotly-latest.min.js"></script>
</head>
<body>
    <div id='target' style="width:600px;height:450px;"></div>
    <script>

        var target_target = document.getElementById('target');
        var layout = {
    title: 'Average retail price for champagnes by year and rating',
    height: 600,
    width: 800,
    showlegend: true,
    xaxis: {
    title: 'highest pro score',
    },
    yaxis: {
    title: 'year',
    },

};

var trace0 =
{
x: ['90.0','91.0','90.0','89.0','91.0','90.0','90.0','91.0','90.0','89.0','93.0','87.0','90.0','90.0'],
y: [1.0, 2.0, 3.0, 4.0, 5.0, 6.0, 7.0, 8.0, 2.0, 9.0, 10.0, 11.0, 6.0, 2.0],
showlegend: true,
marker: {
    size: [21.995, 32.99, 26.99, 20.99, 27.99, 21.8405, 28.475, 22.99, 21.69, 26.8655, 29.99, 24.74, 21.8405, 26.99],
},
mode: 'markers',
type: 'scatter',
name: 'Carneros',
};
var trace1 =
{
x: ['93.0'],
y: [1.0],
showlegend: true,
marker: {
    size: 74.99,
},
mode: 'markers',
type: 'scatter',
name: 'Central Coast',
};
var trace2 =
{
x: ['91.0','93.0','93.0','93.0','94.0','90.0','93.0','87.0','93.0','93.0','87.0','88.0','87.0','87.0','92.0'],
y: [1.0, 2.0, 3.0, 4.0, 5.0, 6.0, 7.0, 3.0, 8.0, 3.0, 3.0, 9.0, 10.0, 10.0, 11.0],
showlegend: true,
marker: {
    size: [29.495, 27.995, 19.99, 39.48, 54.99, 35.49, 57.99, 14.99, 56.99, 28.99, 38.49, 31.49, 33.99, 35.49, 77.49],
},
mode: 'markers',
type: 'scatter',
name: 'Napa Valley',
};

        var data = [ trace0, trace1, trace2];
Plotly.newPlot(target_target, data, layout);
    </script>
</body>
</html>