PLEASE NOTE: IF THE FIGURES ARE NOT RENDERED PROPERLY HERE, PLEASE REFER TO THE FILE 'ML Bioinformatics Project - Report (Final).pdf' TO VIEW THE FULL REPORT
- Dhanusha Duraiyan
- Farzaneh Behzadnia
- Nitanshu Joshi
- Supriya Bidanta
- Paveethran Swaminathan
While computational methods are emerging progressively, our paper focuses on implementing deep learning techniques to compute a viable score for a combination of drug effects on cancer cells. Drug combination therapies are an ingrained concept in cancer treatment. Hence, identifying the novel synergistic combinations is what we are focusing on here. Our models use the chemical structure of drugs and genomic information of various cancer cell lines as input information, a normalization strategy to justify the input data heterogeneity, and tapered layers to model drug synergies.
Cancer cell lines, Chemical Structures, Protein-Protein Interaction, Graph Convolutional Neural network, Graph Neural Network, Message Passing Neural Network, Mean Squared Error.
Mutation has always been a case study in research. Cancer cells have the tendency to adapt according to the nutrients that are available in the environment. According to this, we can assume that the rate of mutation will also be proportional. Hence, the action of a single drug on a target cancer cell will either decrease the cell growth or delay the growth. But there is always a possibility of mutated cancer cells that will be resistant to the drug. Therefore, the approach of a combination of drugs on a single cancer cell is investigated across the world and field of human disease. It has been practically proven that the administration of multiple drugs increases the efficacy of drug treatment when compared to single-drug therapy.
There are always side effects of a single drug. The action of a multiple drugs is not as fascinating as it sounds. Considering the fact that we are ingesting two drugs at a time, we can assume the level of effect that can happen to an organism. Nonetheless, it has been proved that the dose amount of a single drug will always be higher than the combination of drugs. Furthermore, host toxicity and adverse side effects are likely reduced, since doses of drug combinations are typically lower than doses of single agents. There are three different methods to find effective drug combinations. One is clinical experiences which is a naïve method. Another method is high-throughput screening (HTS) and finally, we have computational methods such as machine learning models. The reference of our work, DeepSynergy, is a feed-forward neural network that maps inputs (Drug A, Drug B, Cell Line) to a single output (Synergy Score). It uses both compounds as well as genomic information as inputs. By adding genomic information, DeepSynergy can learn to distinguish different cancer cell lines and find specific drug combinations that have maximal efficacy on a given cell line. DeepSynergy combines information about the cancer cell line and the drug combination in its hidden layers to form a combined representation that eventually leads to accurate predictions of drug synergies.
Previous papers and methods such as the DeepSynergy which uses a deep feedforward neural network that maps inputs Drug A, Drug B, and cell-line, which then passes through the deep network of multiple hidden layers and activation functions and finally outputs a single node that predicts the synergy score. The other paper explains about DeepCell approach that analyzes the drug combinations and is validated systematically by combinatorial CRISPR, drug-drug screening in vitro, and patient-derived xenografts. And another method that uses graph neural networks for drug synergy prediction and investigates the mystery of synergy between drugs and cell lines. All these methods, especially the DeepSynergy and GNN-based methods have performed really well and have proven to be quite effective in the test dataset, as their metric scores show. But, we think it could be more effective to induce the knowledge of drugs and cell lines when their structure of input is converted to graphs and leverage Graph convolution networks or other advanced methods that can make the most use of graph inputs to aggregate information of all nodes and connections, also having the ability to classify between nodes of documents or graphs, and in the molecular world, each of these features can be a huge addition for helping the model understand the correlation between inputs and outputs.
Our method relies on such an ideology, we use two graph neural networks for learning information about each drug A and drug B, a graph convolution network to learn patterns in cancer cell lines of each person, and the gene proteinprotein interactions. And the output embeddings of these two networks are concatenated into one single vector which is then passed through a feedforward neural network, and the last linear node is the synergy score. This way, we utilize not only the molecular mutation information but also the gene relationship information and how different atoms are connected to each other, depending on the bond types. We used the dataset used in the DeepSynergy paper yielding 74 unique drugs. We collected protein target information for drugs from the Therapeutic Target Database and Stanford’s SNAP database, yielding an edge-list matrix of those protein-protein interactions and gene expression profiles for 39 unique cancer cell lines.
Certain methods are restricted to certain pathways, targets, or cell lines, or require transcriptomic data of cell lines under compound treatment. In contrast, our approach only requires a single transcriptomic characterization of the cell line without compound treatment, and the chemical structure of the two drugs. Our method has proved to be good and gives good results on the test dataset, as seen in the next sections of this report. Although our method works better than DeepSynergy and other existing methods by a small margin, there is still a large room for improvement - especially in the computational part and complexity of this model architecture. Correlation scores between the predictions and actual values can be improved much better and decrease the MSE score by making the network deeper and increasing the number of model parameters, and training for a greater number of epochs.
The models that we implemented were all Neural Network models. The Models we used were Graph Neural Network (Message Passing Neural Network) and Molecular Graph Convolutional Neural Network and a feedforward neural network. All graph-type networks we used are a little more advanced than the basic convolution neural networks models.
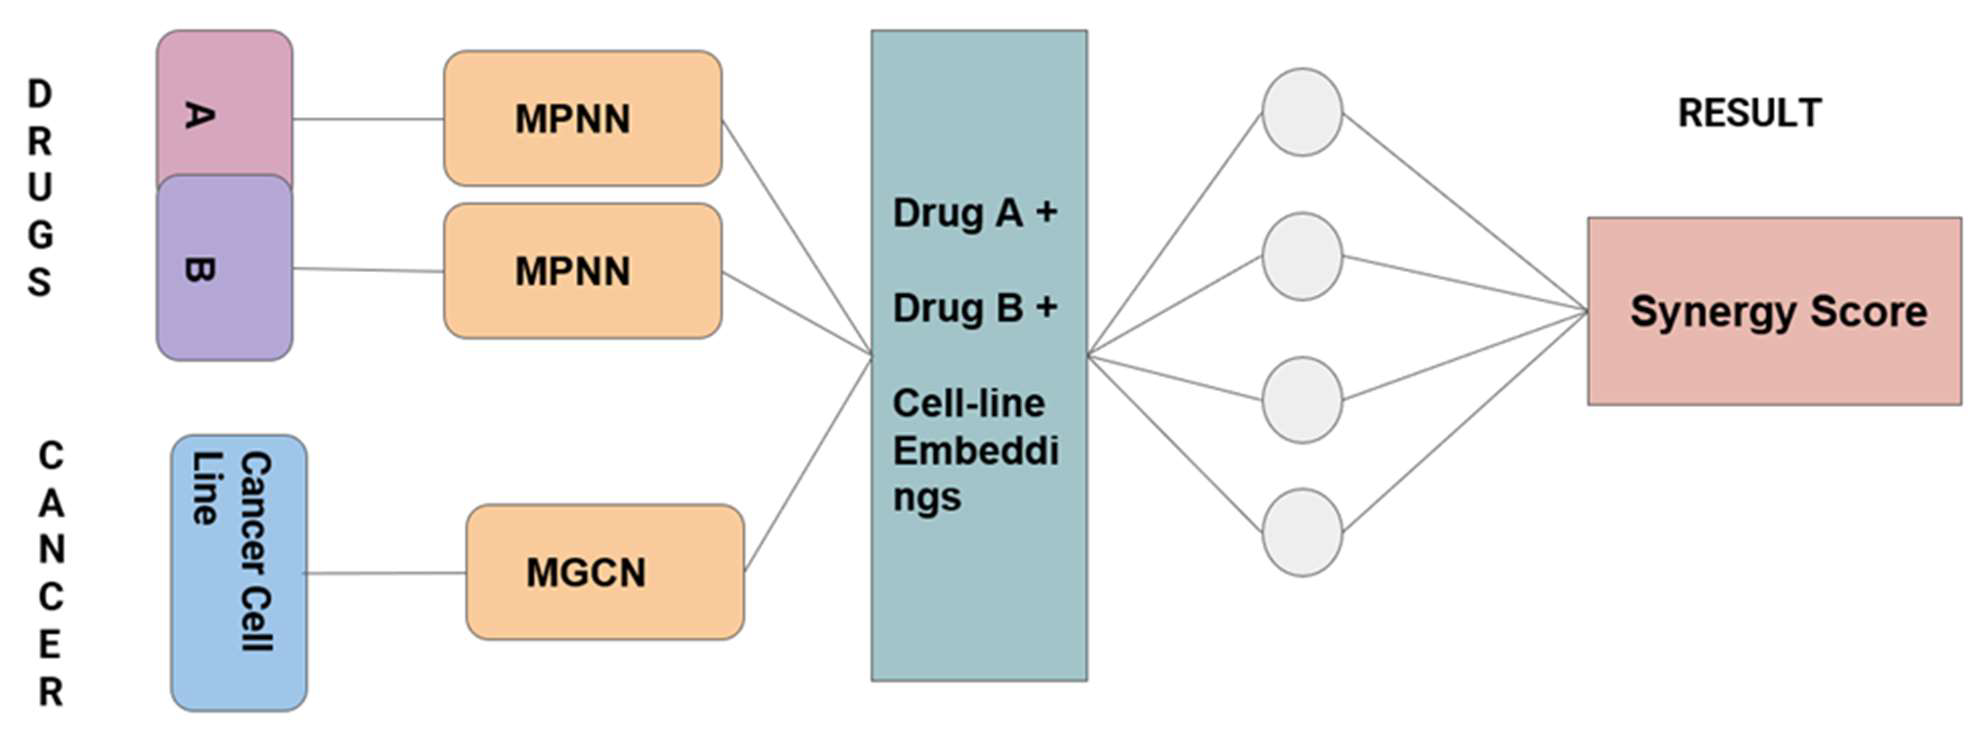
Our model can be divided into two parts –
Part 1: This consists of two Drugs with their structure where we pass each of these drugs through a separate Graph
Neural Network (Message Passing Neural Network).
Part 2: This part required an adjacency matrix as an input. We formed the adjacency matrix by selecting common
genes between the Protein-Protein Interaction pathway dataset and the Cancer Cell Lines dataset. We passed this adjacency matrix through a Graph Convolution Neural Network to generate an output. Here initially we started with 15,000 common genes, but later we made a switch.
Here we merged the outputs from Part 1 and Part 2 as embeddings and concatenated them into one vector embedding. We eventually passed this embedding through a basic Feed Forward Neural network to predict the synergy scores. Figure 1 describes the entire modeling process in the form of a diagram.
For our models, we tried two different functions as activation functions for the hidden layers of our neural networks. Initially, we started with the Tangential Hyperbolic Function (TanH). The performance was not that good using this function, so we switched to the Rectified Linear Activation Function (ReLU) which significantly increased the performance of our model. The output layer just made use of a linear activation function. The mathematical definitions of the functions are given below along with the figures. Tangential Hyperbolic Function (TanH): Rectified Linear Activation Function (ReLU): F(x) = max (0, x) Figure 2 – TanH and ReLU functions
For our model we made the use of two major regression metrics:
- Mean Squared Error (MSE)
- R-Squared Error (R2 score)
Mean Squared Error: It is the most basic regression metric. It is the difference between the True value and the predicted value squared and averaged. Mathematically it can be represented as MSE = (1/n) Σ (YTRUE - YPREDICTED)2
R-Squared Value (Coefficient of Determination): This is a measure that represents the proportion of the variance for the target variable that can be explained by a predictor variable in any regression model. It is mathematically represented as – R2_Score = 1 – (Residual Sum of Squares) / (Total Sum of Squares)
For our model, we made a train-test split of 80:20. We mainly trained the data with training data by making multiple training-validation splits. Ultimately after training our model, we tested our model on the testing partition. Apart from that, we experimented with various epoch sizes. Initially, we started with 15 epochs which gave us very poor metric values. Eventually, we increased the size of the epochs to 100, and the model performance significantly increased with a well-shaped training curve with decreasing loss as the number of epochs increased. Also, we trained around 2,312,301 parameters.
The data set that we used in our model consists of two inputs, one chemical structure of drugs and another has details of the cancer cell line and its protein-protein interaction. Pairwise combinations were constructed from 75 diverse anticancer drugs against 39 unique cancer cell lines. In addition, we use 15000 unique gene ids for proteinprotein interaction matrix and for gene expression. Since it will result in a huge matrix, we removed some low variance genes, and finally, we used 7524 genes for our analysis.
S score (Synergy score) defines the degree of interaction between genomic features and the chemical structure of drugs. To categorize a combination of drugs as efficient for a cancer cell line we must calculate the combinatory score for that particular cell line. But there is no particular threshold to define a good synergy score since combination synergy is highly context specific. In order to use the SMILES of the chemical structure of the drugs as numeric input, we converted them into fingerprints using Weisfeiler-Lehman algorithm. Figure 3: Drugs’ chemical structure and their synergy score dataset.
The cell lines were represented by their gene expression. In addition, we mapped these gene expressions with the protein-protein-based interactions score for respected cell lines. Figure 4: Upper image describes the gene expression for cancer cell line whereas the lower image depicts the proteinprotein interaction score.
The project includes two kinds of neural networks to train the data. The first is Message Passing Neural Network (Molecular Graph Neural Network). The section of our model predicts the quantum properties of an organic molecule by modeling a computationally expensive DFT calculation. Second, Graph Convolutional Neural Network integrates cancer cell line genes with protein-protein interaction scores. Figure 5: A workflow of Message Passing Neural Network
The performance of our model was measured using Mean Squared Error and R2 score. Table 1 summarizes the comparison between DeepSynergy model, Gradient Boosting Machines, and MPNN combining the GCN model. MSE for the later model was 160.579 with 100 epochs with an R2 score of 0.29. Sl No Model MSE Pearson’s r 1 Deep Neural Networks 255.49 0.73 ± 0.04 2 Gradient Boosting Machines 275.39 0.69 ± 0.02 3 MPNN + GCN 160.579 0.354 Table 1: Model comparison between DeepSynergy, Gradient Boosting Machines and Graph Neural network based on Mean squared error and Pearson's R value.
We ran the models with varying sizes of epochs namely 15, 100, and 420. We observed the following training curves from all three epochs while the model trained on the data. The error/loss we considered here is the mean squared error. Figure 6 - Training curves for 15, 100, and 420 respectively Looking at the training curves we observed that as the number of epochs for training increased the model started to generalize well. It can be observed that the training curve starts to saturate at a mean squared error of around 300 on the training set as we reach epoch number 200.
Also, we plotted the performance on the test set for the number of epochs 100, and 420 respectively. Figure 7 - Prediction vs Actual curves for testing data for 100 and 420 epochs respectively From the plots for prediction vs training, we saw quite some difference in the prediction curves between the model trained on 100 epochs and the model trained on 420 epochs. Even though the correlation score is low, we can see that the model is able to predict to an extent the direction and the magnitude of the synergy scores for every drugcell line pair in test data. For example, in the 80th row of the test dataset, we can see that the actual synergy score of that point is around 40 to 60. But the model trained on 100 epochs could not detect this rise and just predicted a value close to the average synergy values of other data points. But the model at 400 epochs captured something different in this drug-cell line value, and it has learned some patterns that allowed it to push its prediction beyond the average value of synergy scores and give out a prediction around 75 to 80. With that, we can improve the model 4x better by increasing the number of model parameters - by increasing the non-linearity of the network, adding more hidden layers and training on more epochs, and adjusting activation functions to achieve a better minimum, and thus have a better performing model.
As compared to Deep Synergy’s model, we observed that our model performed better on the testing/unseen data. Our model observed testing mean squared error of 160.58 as compared to 255.49 produced by DeepSynergy’s model.
While working on this project we encountered multiple problems. One of the primary issues was the complexity of the Neural Network models. Since graph neural networks are a form of Semi-Supervised learning models, their implementation in python can be a little complex. Also, we used PyTorch as the main library for Deep Learning. One of the issues we faced was executing the model through GPU/Cuda. Since PyTorch requires all tensors to be passed to the GPU separately, we were not able to do so properly. Instead, we had to run our model using a CPU which took more time. Due to this increase, the number of training epochs became extremely hard. This is the main reason why we were only able to implement 420 epochs.
As mentioned before, there is plenty of room for improvement, and one way is by increasing the number of model parameters - by increasing the non-linearity of the network, adding more hidden layers and by training on more epochs, and adjusting activation functions to achieve a better minimum, and thus have a better performing model. Also, as of now, there is just one convolving layer in the GCN, maybe by having more convolving layers the performance might increase. Also, having some prior knowledge about genes and adding some useful information about drug and gene relationships can help the model work better.
[1] Kristina Preuer, Richard P I Lewis, Sepp Hochreiter, Andreas Bender, Krishna C Bulusu, Günter Klambauer, DeepSynergy: predicting anti-cancer drug synergy with Deep Learning, Bioinformatics, Volume 34, Issue 9, 01 May 2018, Pages 1538–1546, https://doi.org/10.1093/bioinformatics/btx806 [2] Alina Malyutina, Muntasir Mamun Majumder,Wenyu Wang,Caroline A. Heckman,Jing Tang, Drug combination sensitivity scoring facilitates the discovery of synergistic and efficacious drug combinations in cancer,Bioinformatics, Volume 2, May 20, 2019 , https://doi.org/10.1371/journal.pcbi.1006752 [3] Chou T.-C. (2006) Theoretical basis, experimental design, and computerized simulation of synergism and antagonism in drug combination studies. Pharmacol. Rev., 58, 621–681. [4] Csermely P. et al. (2013) Structure and dynamics of molecular networks: a novel paradigm of drug discovery. Pharmacology and Therapeutics, 138, 333–408. [5] Hecht J.R. et al. (2009) A randomized phase IIIB trial of chemotherapy, bevacizumab, and panitumumab compared with chemotherapy and bevacizumab alone for metastatic colorectal cancer. J. Clin. Oncol., 27, 672–680. [5] Huang Y. et al. (2016) Fulvestrant reverses doxorubicin resistance in multidrug-resistant breast cell lines independent of estrogen receptor expression. Oncol. Rep., 37, 705–712. [6] Jia J. et al. (2009) Mechanisms of drug combinations: interaction and network perspectives. Nat. Rev. Drug Discov., 8, 111–128. [6] Kruijtzer C. et al. (2002) Increased oral bioavailability of topotecan in combination with the breast cancer resistance protein and p-glycoprotein inhibitor GF120918. J. Clin. Oncol., 20, 2943–2950. [7] O’neil J. et al. (2016) An unbiased oncology compound screen to identify novel combination strategies. Mol. Cancer Therap., 15, 1155–1162. [8] Tol J. et al. (2009) Chemotherapy, bevacizumab, and cetuximab in metastatic colorectal cancer. N. Engl. J. Med., 360, 563–572. [9] Tooker P. et al. (2007) Bexarotene (LGD1069, targretin), a selective retinoid x receptor agonist, prevents and reverses gemcitabine resistance in NSCLC cells by modulating gene amplification. Cancer Res., 67, 4425–4433.