Performance Test for S3 Streaming Ingestion Queries #1151
Description
1. Overview
This issue focuses on measuring throughput and latency of streaming PPL queries from S3 to OpenSearch. Logs will be generated by flog and written to disk, then fluent-bit will parse the log files and bulk send to S3. SQL plugin will periodically (every 10s) scan S3 prefix and ingest any new objects to OpenSearch.
Some variables that could affect performance:
- CPU, memory, JVM heap size (manually set to half of OS memory)
- Log file format (fluent-bit will gzip compress before upload)
- Log chunk size (using 50M)
- Partition:
/tag/year/month/day/hour/minute/second/UUID.gz
Log format
-
From fluent-bit raw log:
{"@timestamp":"2022-12-07 00:00:54.743155","filename":"/data/generated.log","host":"117.68.123.54","user-identifier":"howe6675","datetime":"07/Dec/2022:00:00:51 +0000","method":"GET","request":"/metrics/innovative/transition","protocol":"HTTP/1.1","status":403,"bytes":14375,"referer":"https://www.internationalstreamline.com/matrix/scale/empower"} -
Trace:
{"traceId":"00000000000000002a63ee08d36e190c","spanId":"2a63ee08d36e190c","traceState":"","parentSpanId":"","name":"/product","kind":"SPAN_KIND_UNSPECIFIED","startTime":"2021-05-13T02:01:04.925Z","startTime2":1620871264925,"endTime":"2021-05-13T02:01:05.439Z","durationInNanos":514000000,"serviceName":"frontend","events":[],"links":[],"droppedAttributesCount":0,"droppedEventsCount":0,"droppedLinksCount":0,"traceGroup":"/product","traceGroupFields.endTime":"2021-05-13T02:01:05.439Z","traceGroupFields.statusCode":0,"traceGroupFields.durationInNanos":514000000,"span.attributes.http@url":"http://frontend/product","span.attributes.absolute-adamant-amoonguss":"pu72nxWcjhGpLDmz","span.attributes.actual-sassy-ampharos":"aayFo6rvUnCdoeeF","span.attributes.aggressive-sassy-aron":"TS2p3Jwv97w97Jfm","span.attributes.academic-lax-aggron":"EUZw8yprUvyu28mZ","span.attributes.angelic-sassy-arcanine":"kMhmyVvYuyEj82dG","span.attributes.aggressive-sassy-barboach":"5tL1rUhj8nYzuAYk","span.attributes.active-sassy-aegislash":"MZiR6tK3NgChoWiT","span.attributes.absolute-sassy-beldum":"IVNErG7ayMDWBHnj","span.attributes.adored-sassy-accelgor":"IzHhy8Sq7DlGeqhu","span.attributes.absolute-calm-abomasnow":"K0lEPbGVFsksSw50","span.attributes.absolute-calm-alomomola":"QXFrEzJlrPSOLK9k","span.attributes.acceptable-hardy-aipom":"nETfp779PJQ2uYFq","span.attributes.adventurous-modest-amoonguss":"aZ847mlzTKeOtE9q","span.attributes.acceptable-hardy-arcanine":"vxAnFgcLbvCP3gPv","span.attributes.aggressive-sassy-amoonguss":"2iSz8uC8jAkhRpy7","span.attributes.alert-sassy-archeops":"jtDZiLupvlvaS1Jq","span.attributes.acrobatic-sassy-aurorus":"MjsQ5XRlGoJBrtT7","span.attributes.absolute-calm-aerodactyl":"gwhPVTZkMi5xn8KH","span.attributes.acrobatic-sassy-ariados":"qP8h7u0vIy2Wgckn","span.attributes.abandoned-calm-abomasnow":"Zyj4vsYek2Jv4o3J","span.attributes.absolute-impish-accelgor":"yTVXFvXYDm6XDghN","span.attributes.acidic-hasty-ambipom":"8TiU7Hk6MxqAAKy6","span.attributes.admirable-bashful-ampharos":"CdCNc9h2UVoo3fun","span.attributes.absolute-sassy-arcanine":"ueO8DglnXKbj7IqI","span.attributes.absolute-calm-abra":"Nqf3oWtQLaLap0LH","span.attributes.active-sassy-axew":"T4xuc3kIUTX0JLf0","span.attributes.absolute-calm-ariados":"F3YQM1KyuwuBWI8u","span.attributes.aggressive-sassy-aurorus":"Cnq2GEO8MF7ohdsA","resource.attributes.service@name":"frontend","status.code":0,"span.attributes.adorable-gentle-accelgor":"9CW9vSc1fAH7ZuXT","span.attributes.affectionate-sassy-anorith":"jCoq2FIsklK328KN","span.attributes.actual-lax-anorith":"5uWqKv4qYrfz4ATd","span.attributes.absolute-sassy-amoonguss":"OqqKVgwhMfEyXyq9","span.attributes.absolute-sassy-accelgor":"4txnKpZXcL3sDJjr","span.attributes.starter":"charmander","span.attributes.version":"v127","span.attributes.acrobatic-careful-aegislash":"95ZPVEyp5kL8fe12","span.attributes.able-hardy-absol":"2UfJMoOApaHxfC49","span.attributes.adored-sassy-anorith":"qhQOaaq83wRH9uoN","span.attributes.acclaimed-bold-absol":"ytleX1oiaMiRiJIu","span.attributes.actual-sassy-bagon":"Pkb5dTvLL6Qdx9Yu","span.attributes.http@method":"GET","span.attributes.instance":"frontend-6b654dbf57-zq8dt","span.attributes.agreeable-sassy-ambipom":"O79uLnvnyNAVLf4p","span.attributes.admirable-sassy-arcanine":"Ry8N4hc48ytT1BD3","span.attributes.advanced-sassy-arcanine":"cWqFdpvZNjtZouDb","span.attributes.absolute-brave-accelgor":"EWaikliRmWJFNOes","span.attributes.abandoned-calm-abra":"IO1B3ofkawBKpnFB","span.attributes.adventurous-modest-absol":"w3VTPpE2qlTvyhRy","span.attributes.absolute-calm-accelgor":"AMddqkJFL5FyHLun","span.attributes.ample-sassy-beautifly":"3Ry8siuIWLe7zTpR","span.attributes.admirable-sassy-bagon":"duv6UEzqr0viR2KQ","span.attributes.affectionate-sassy-azumarill":"13n5mqh35x2nrksc","span.attributes.region":"us-east-1","span.attributes.net@host@ip":"172.20.0.9"}
Fields being ingested to OpenSearch (table definition in create table)
- Affects CPU requirements
- Chose some fields from raw log
@timestamp date     # "@timestamp" : "2022-12-07 00:00:54.743232",
host string         # "host" : "91.200.198.147",
method string       # "method" : "HEAD",
request string      # "request" : "/schemas/reinvent/drive/value-added",
protocol string     # "protocol" : "HTTP/2.0",
status integer      # "status" : 304,
bytes integer       # "bytes" : 29903,
- Trace
traceId string
spanId string
traceState string
parentSpanId string
name string
kind string
startTime string
endTime string
durationInNanos integer
serviceName string
droppedAttributesCount integer
droppedEventsCount integer
droppedLinksCount integer
status.code integer
traceGroup string
traceGroupFields.endTime string
traceGroupFields.statusCode integer
traceGroupFields.durationInNanos integer
span.attributes.region string
2. Targeted performance
500GB per day, approximately 20.8GB per hour or 5.8MB per second.
3. Results
The minimum instance type needed for 500GB per day is 4C8G (c7g.xlarge), any smaller instance won’t be able to keep up ingestion with new logs in S3 and heap will eventually overflow.
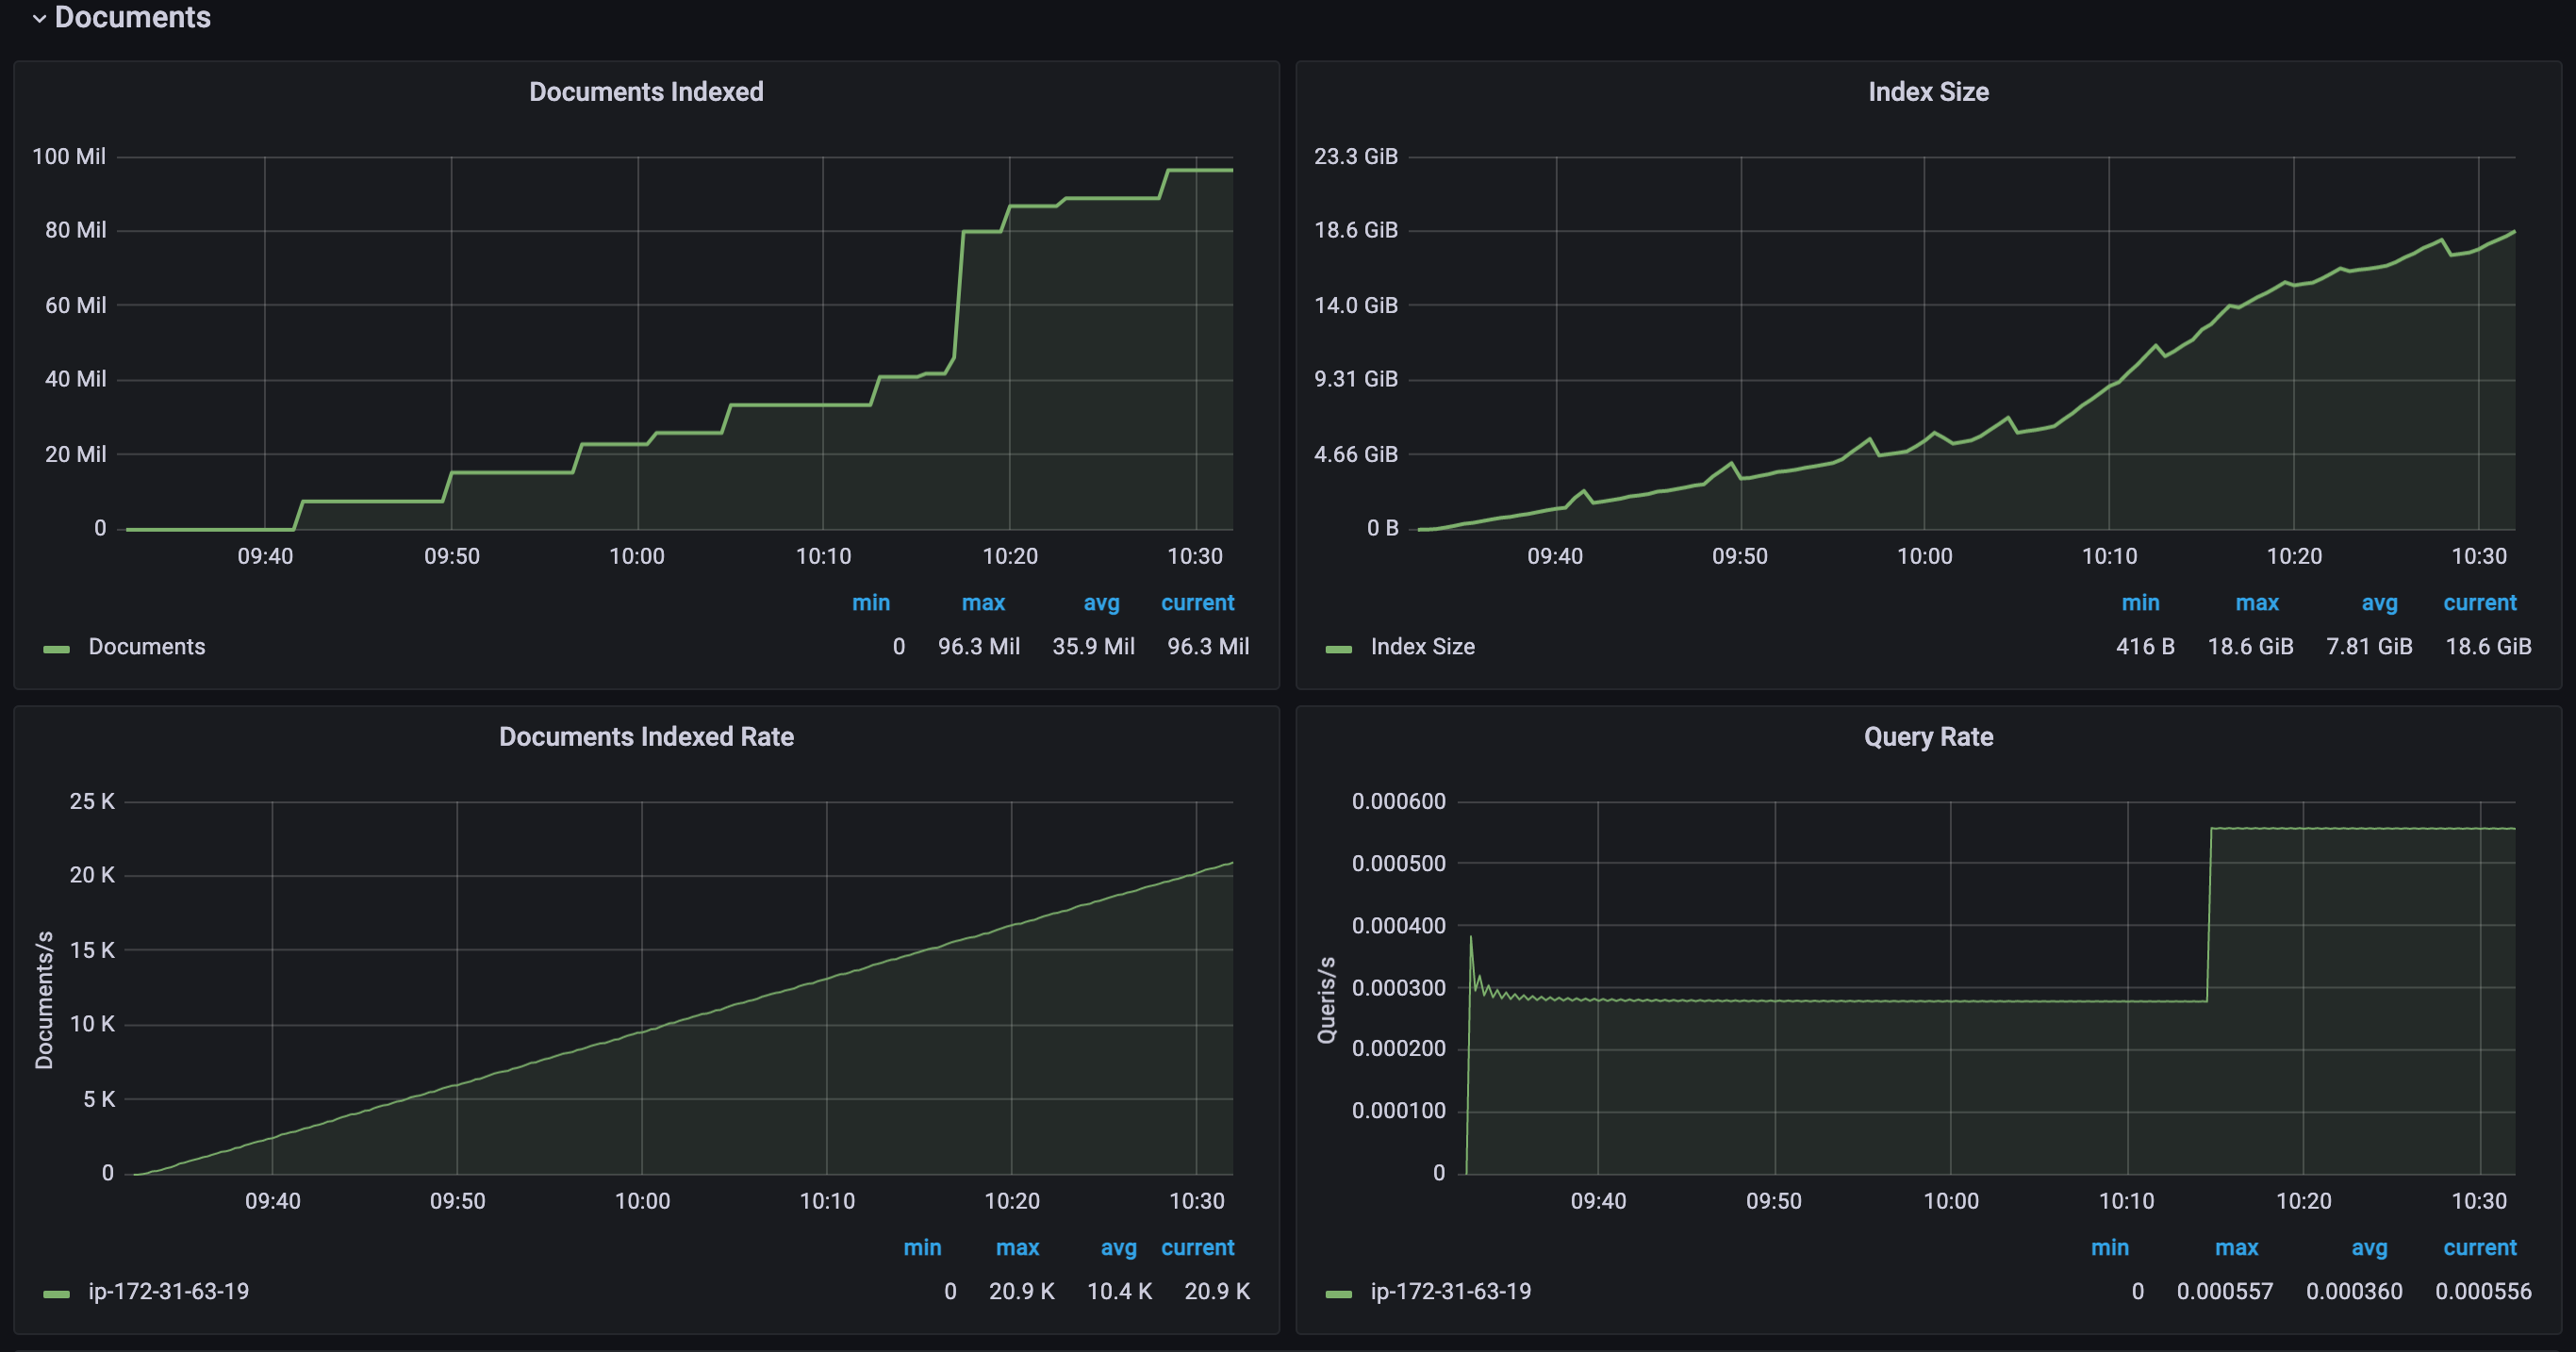
Throughput from MicroBatchTask
- in reality throughput should be about 90% due to other overheads
- measured using batch size of 50k
| Instance type | Throughput | Speed increase per vCPU | ||
|---|---|---|---|---|
| 2 vCPU | 15.0GB / hour | 4.3MB / s | 15k docs / s | |
| 4 vCPU | 23.1GB / hour | 6.42MB / s | 23.3k docs / s | 27.67% |
| 8 vCPU | 35.4GB / hour | 9.84MB / s | 30.2k docs / s | 5.71% |
| 16 vCPU | 37.1GB / hour | 10.31MB / s | 31.7k docs / s | 0.62% |
| 32 vCPU | 37.0GB / hour | 10.28MB / s | 31.5 docs / s | 0% |
All other metrics are from a c7g.xlarge (4 vCPU) instance with 50k batch size
Stats
| Stat | Value |
|---|---|
| min(docs_per_second) | 3204.1767755754895 |
| max(docs_per_second) | 33902.40973679726 |
| avg(docs_per_second) | 25717.473504336773 |
| percentile(docs_per_second, 0.01) | 8738.96171469495 |
| percentile(docs_per_second, 0.1) | 14057.746868249928 |
| percentile(docs_per_second, 0.5) | 29736.341147028033 |
| percentile(docs_per_second, 0.9) | 32173.72116267387 |
| percentile(docs_per_second, 0.99) | 33368.705989963324 |
| stddev_pop(docs_per_second) | 7862.304081554568 |
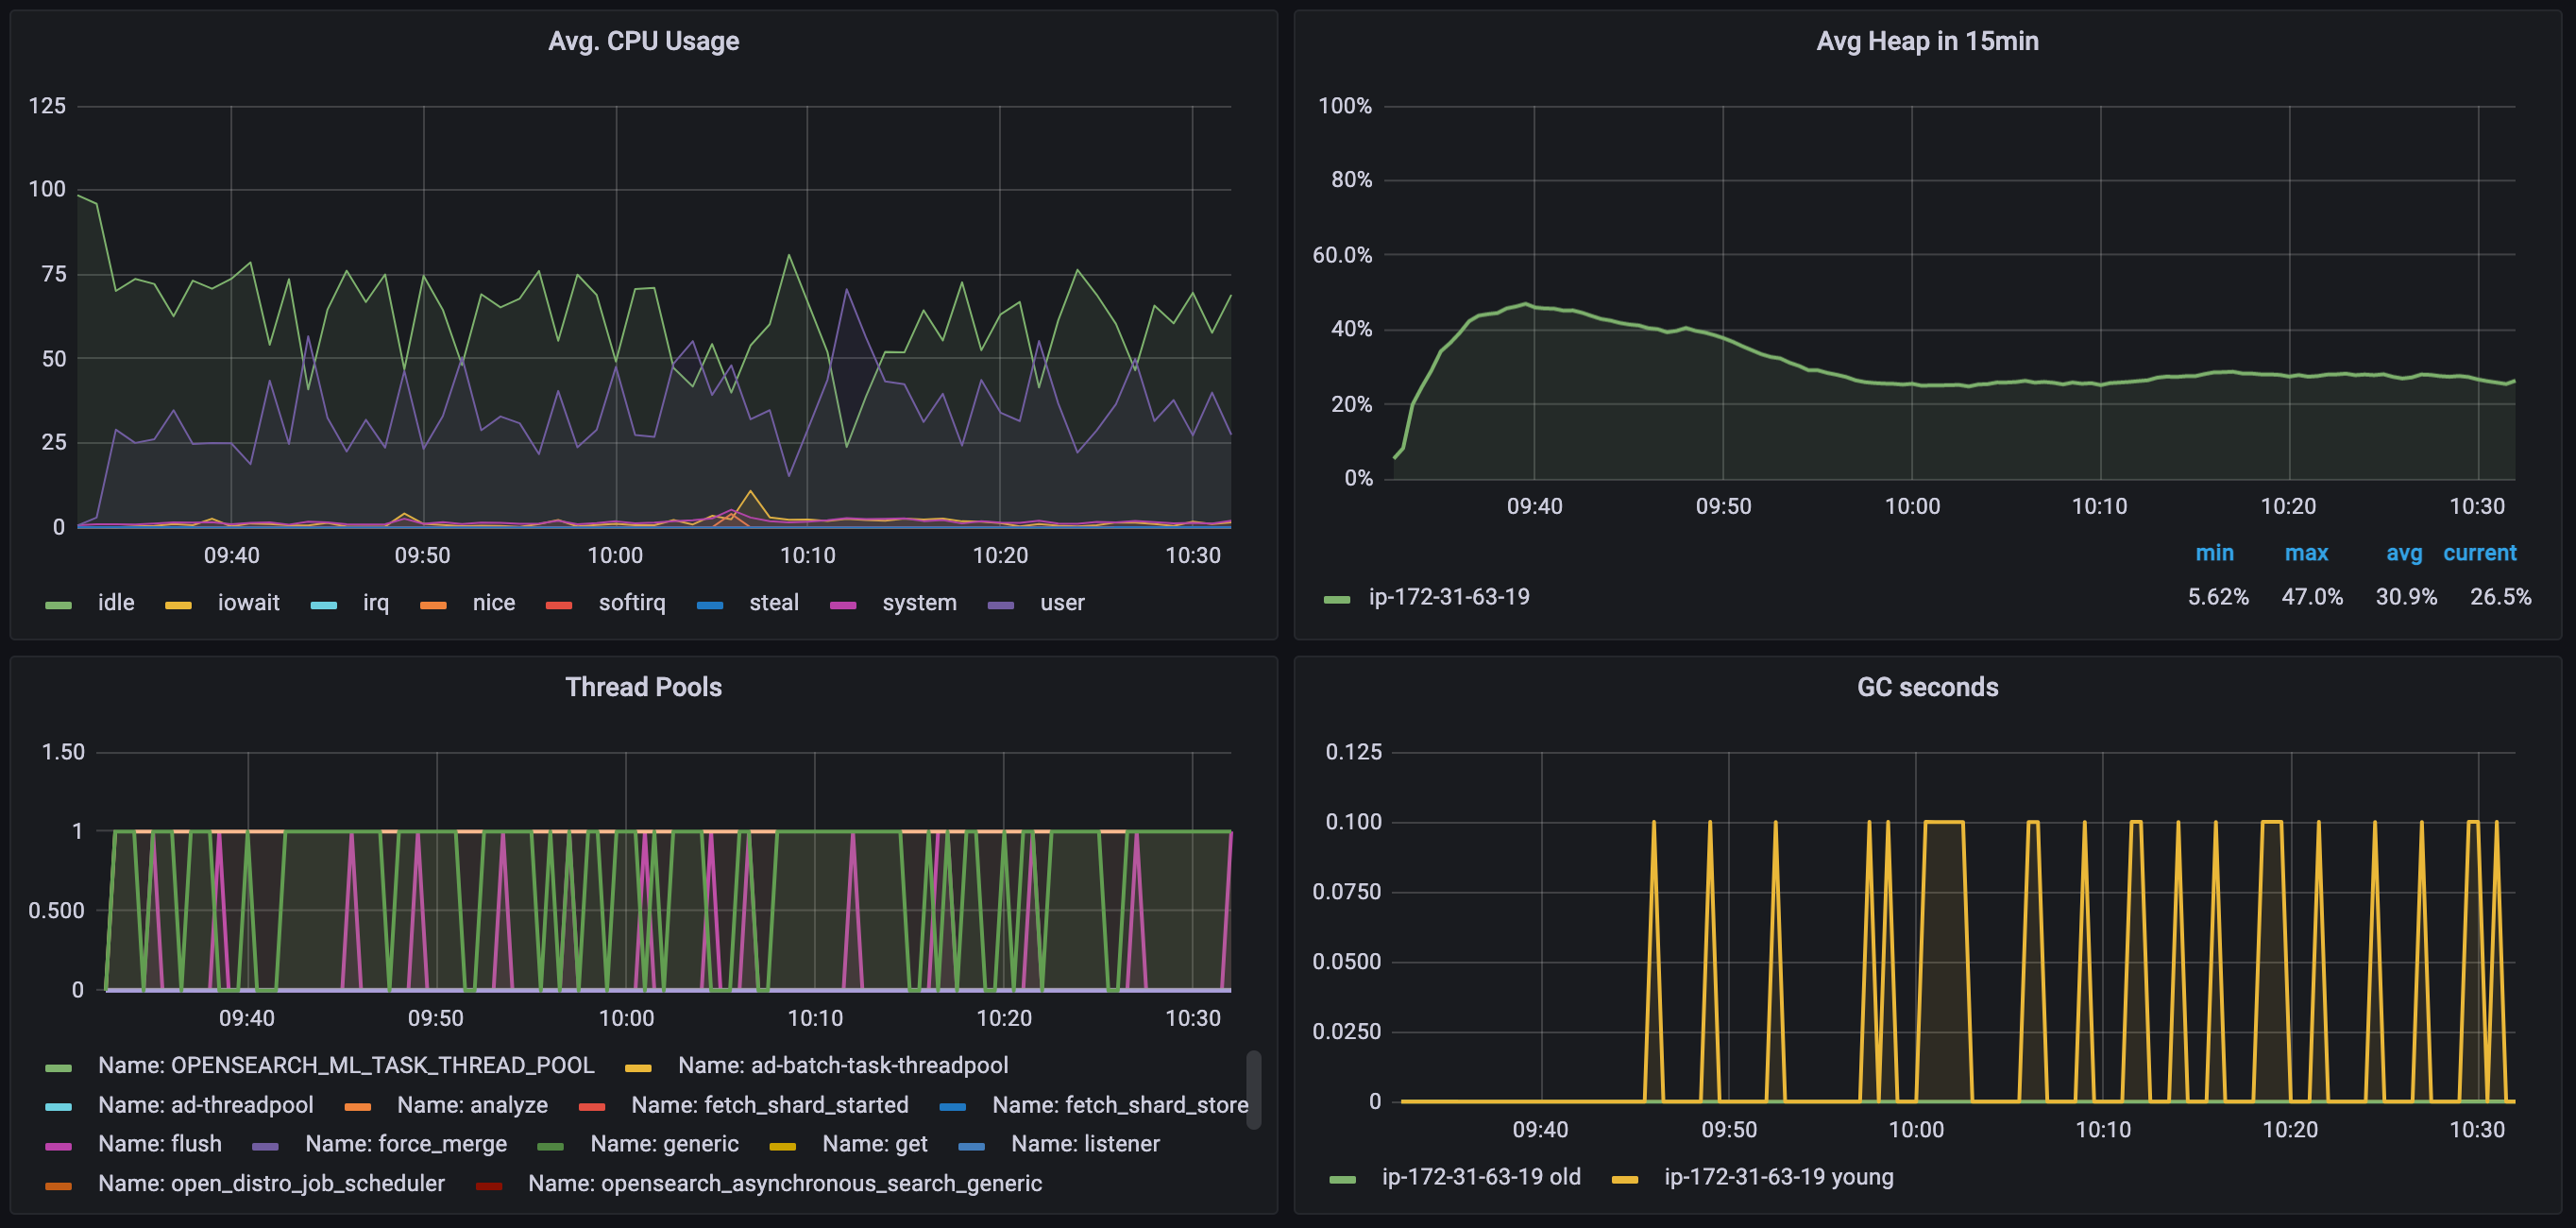
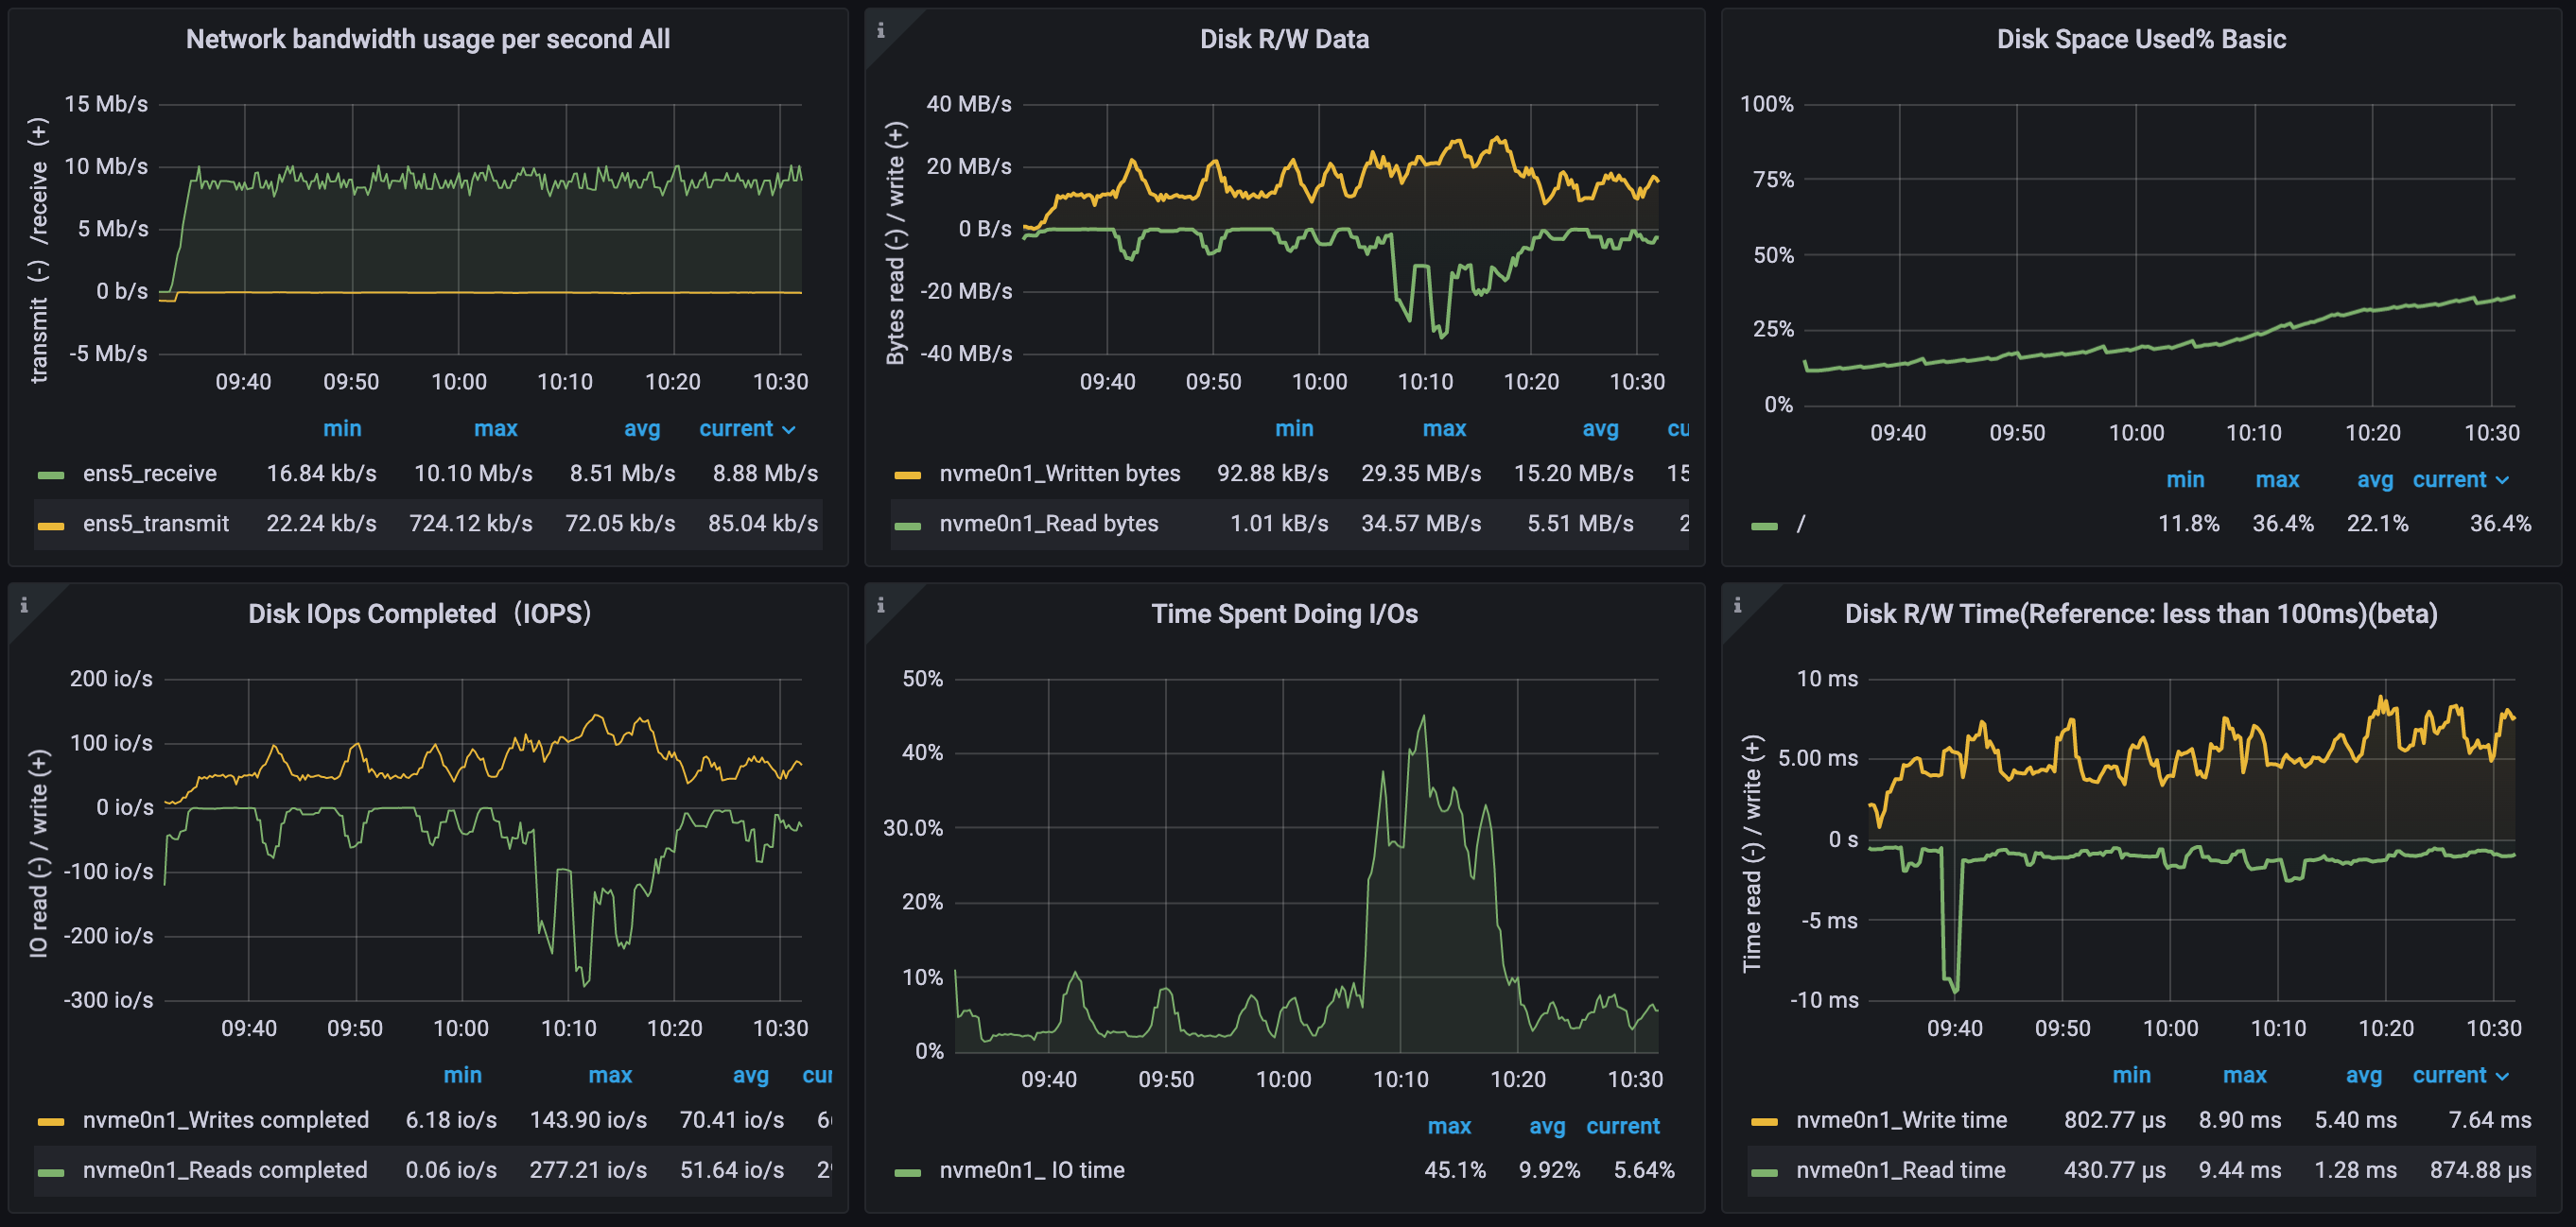
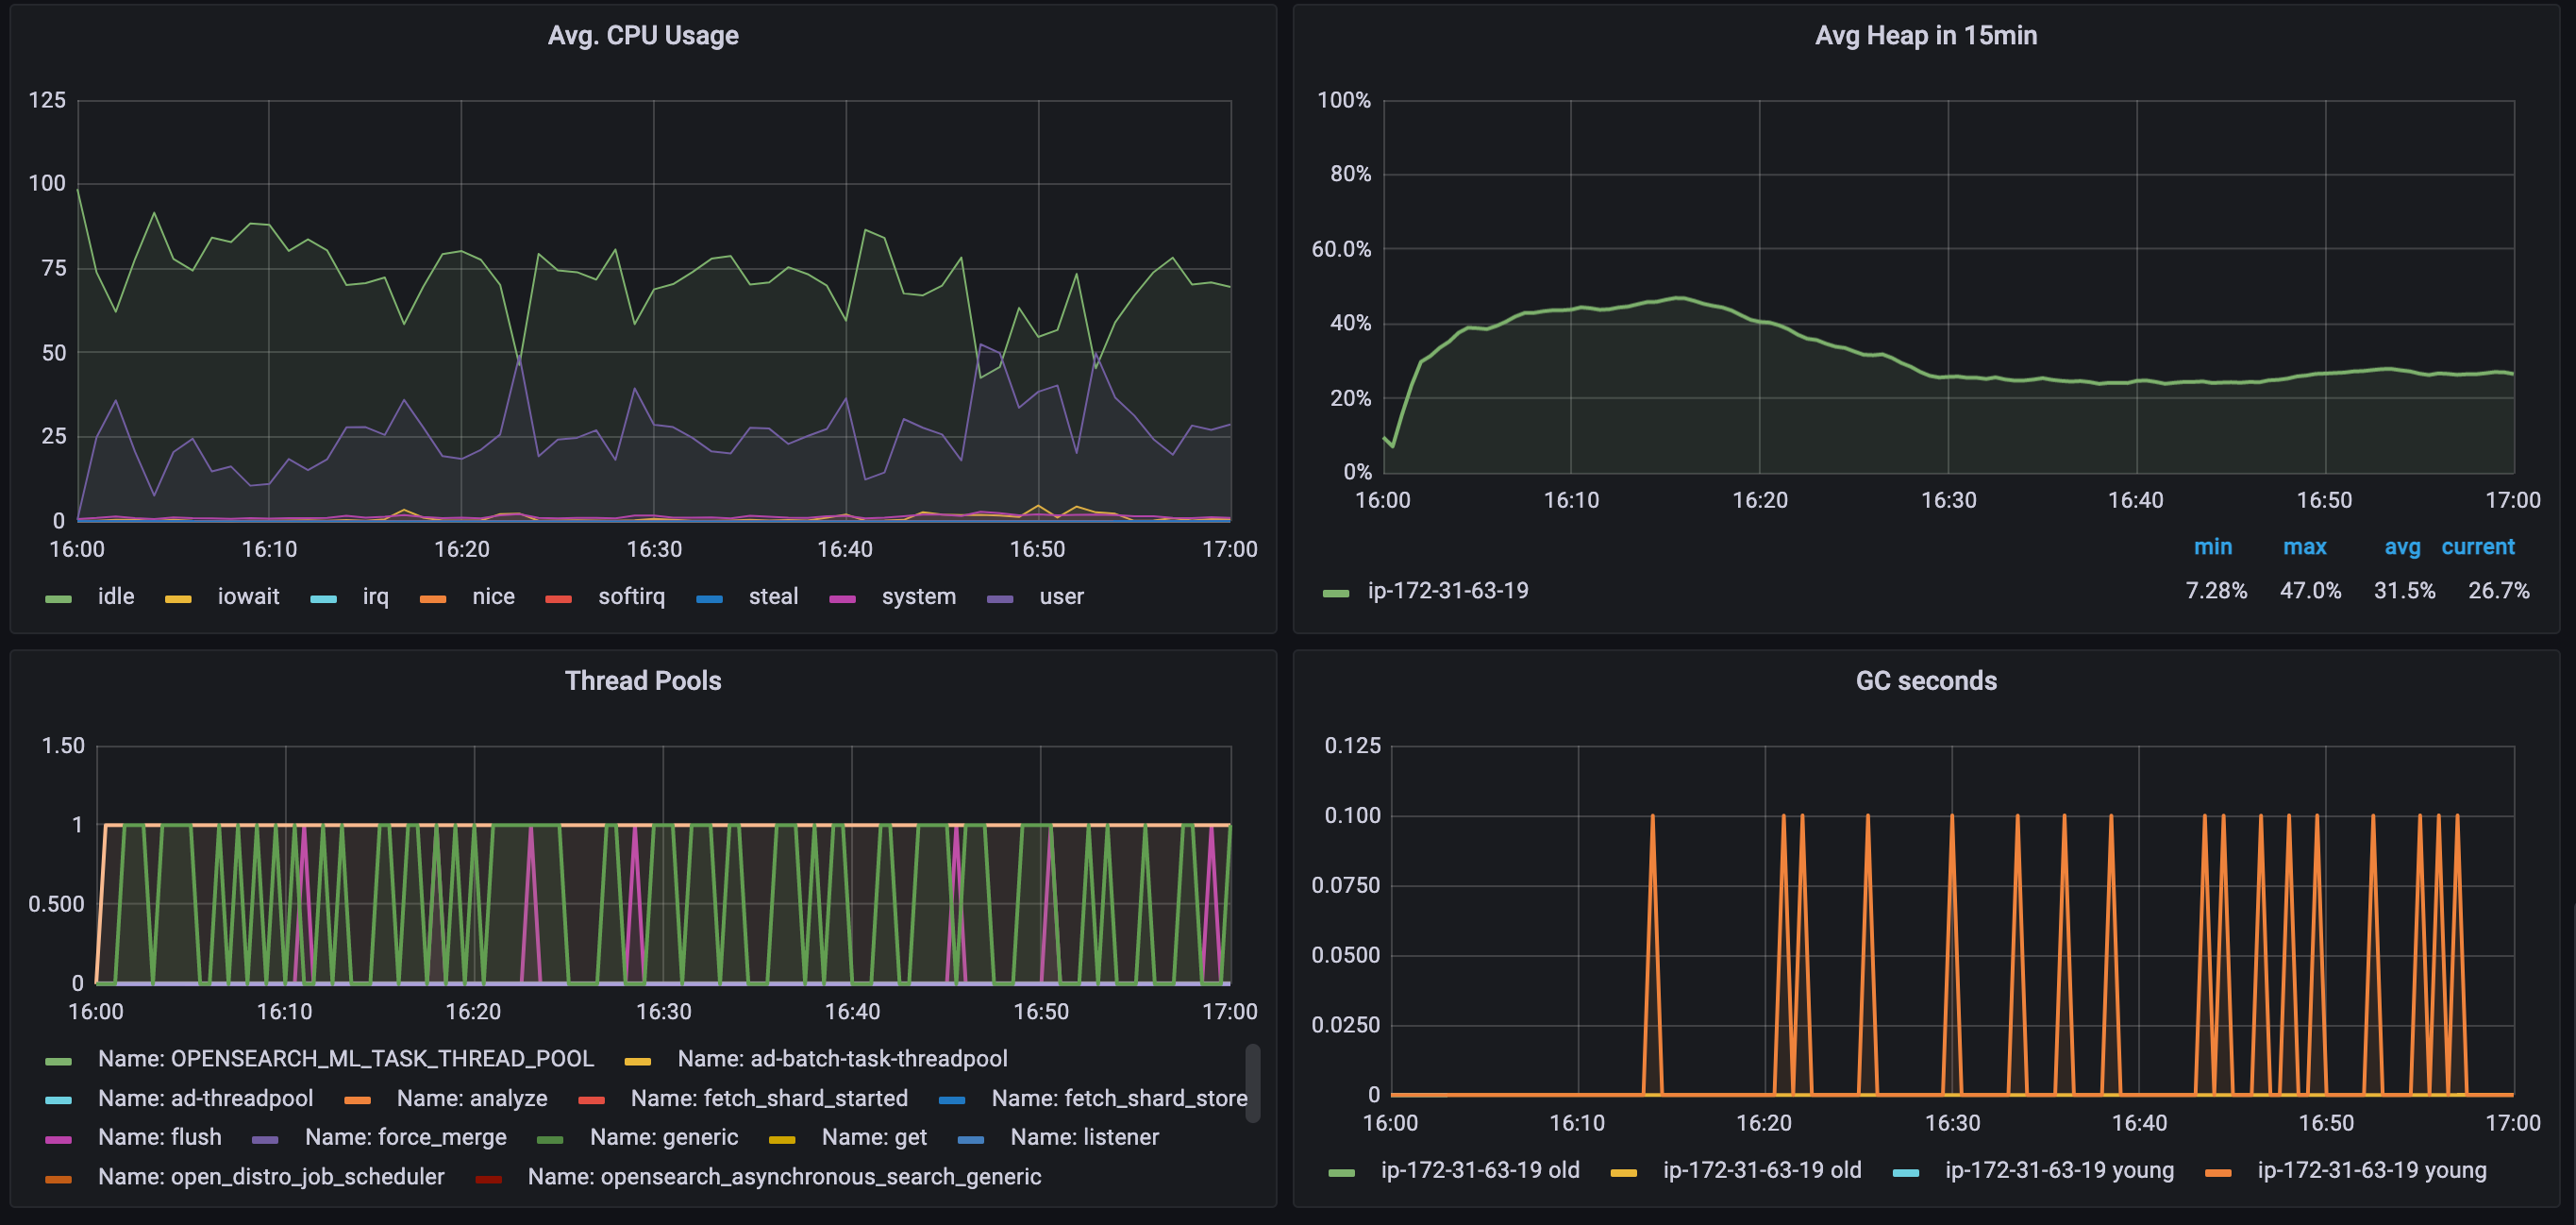
Resource usage
Streaming query with filter
INSERT INTO mylogs AS STREAM source=s3.httplogs | where status > 29922.3k docs per second (ingested), 28.6% logs filtered out, not seeing performance impacts
Batch size
Number of documents to send in one bulk request, maximum 10% difference. Should be adjusted based on input structure and cluster size.
| Batch size | docs / second | MB / second | bulk request took |
|---|---|---|---|
| 10k | 23.4k | 6.47 | 84.12% |
| 50k | 23.3k | 6.42 | 84.26% |
| 100k | 24.0k | 6.88 | 84.23% |
| unlimited | 21.7k | 6.08 | 85.01% |
Index refresh off
Disabled index refresh, no significant difference
| Batch size | docs / second | MB / second | Speed change |
|---|---|---|---|
| 50k | 22.0k | 6.14 | -5.58% |
| unlimited | 21.6k | 6.05 | -0.46% |
curl -X PUT "localhost:9200/mylogs/_settings?pretty" -H 'Content-Type: application/json' -d'
{
  "index" : {
    "refresh_interval" : "-1"
  }
}'
Trace data performance (4 vCPU)
Docs throughput: 15.0k docs / second, 35.5% slower
Bytes throughput: 15.43 MB / second, 140% faster
This is because there are more columns in trace data, a trace document is larger than a log document. (Trace data has time in ISO format, which SQL doesn’t support. Also there can be dynamic fields for attributes, ignored them for now)
TODO
- Measure aggregation queries
- Measure latency