Repository navigation
Garbage collection changes in 8.7.0 #917
Description
Activity
/CC @nodejs/v8
Are the spikes problematic? Is it affecting latency or throughput?
Also, what do you measure? RSS, JS heap size, something else?
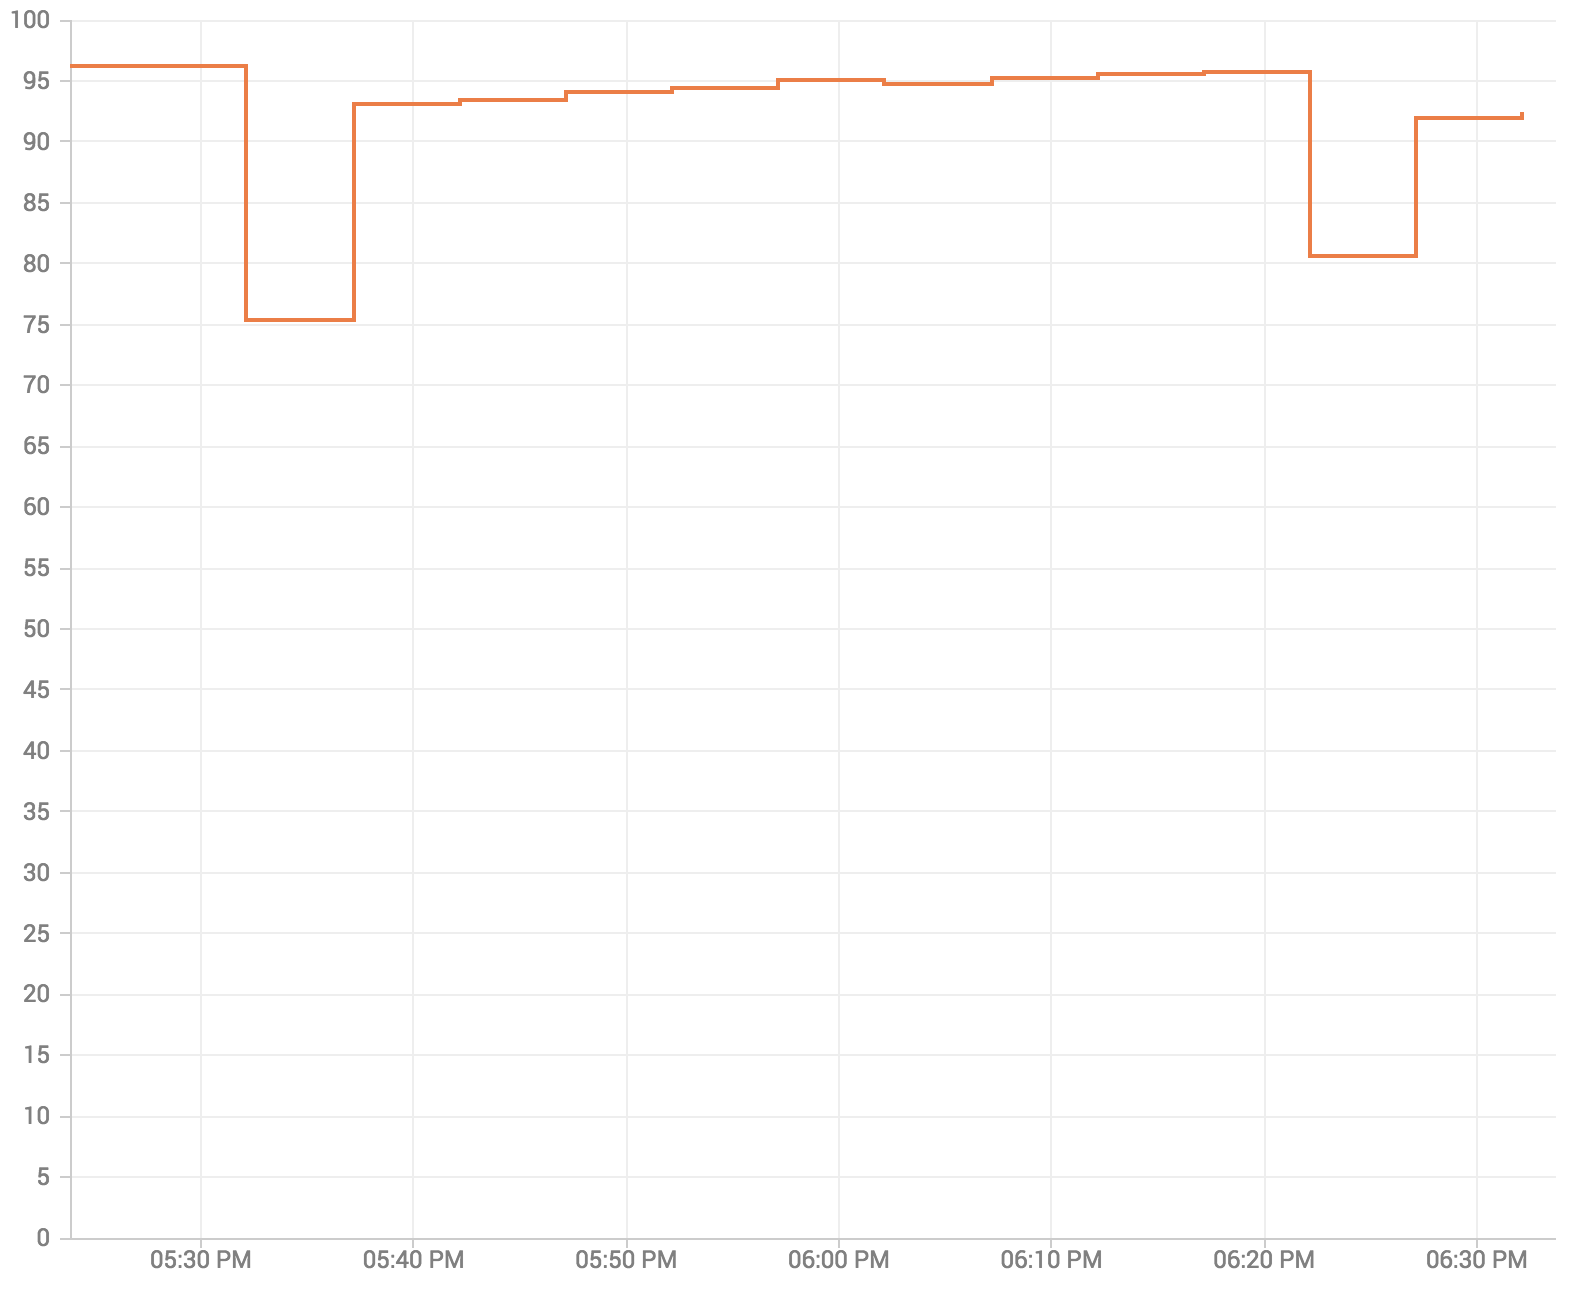
@bnoordhuis The spikes themselves are only rarely problematic, but the change in footprint is. Instead of a clear baseline, there is now a huge deviation between the upper-bound and lower-bound of the used memory, with the upper-bound sometimes being as much as 3 times the baseline (see attached image), while the software runs on a device with only 512mb RAM. Before 8.7.0 this has never caused any problems, but now the system starts swapping a lot of memory back and forth to deal with these changes. The spikes themselves only cause problems when they occur simultaneously with a (non-nodejs) speech synthesis thread that plays generated speech over a speaker. The output starts to lag in this case, most likely due to a combination of swapping and higher cpu usage.
The measurements are of the RSS, and are taken by
process.memoryUsage().rss / 1024 / 1024in 15 minute intervals.
As a sidenote, I've downgraded Node to 8.6.0, and can confirm the old memory footprint returned.
There are no incremental sweeps. Full GCs do incremental marking, parallel compaction and concurrent sweeping. Incremental marking is started when being close to some heap limit.
The spikes look like something is allocating a lot of garbage memory at a high rate.
Could you post the output when running with
--trace-gc --trace-gc-verbose --trace-incremental-markingAlso, if you are running with any heap limits (e.g.
--max-old-space-size) it would be good to provide that info too.I was running with
--max_old_space_size=256as the only limit. I've now started a test device using--max_old_space_size=256 --trace-gc --trace-gc-verbose --trace-incremental-marking. How long would you like it to run?@mlippautz It's been running for 1 hour now, but it looks like the huge spikes do not show up when running with the trace flags.
The flags only print and don't change behavior.
Also, unsurprisingly, the log doesn't show any odd behavior.
I'll restart it and let it run over the night to see if anything changes, as the previous graphs all spanned multiple days.
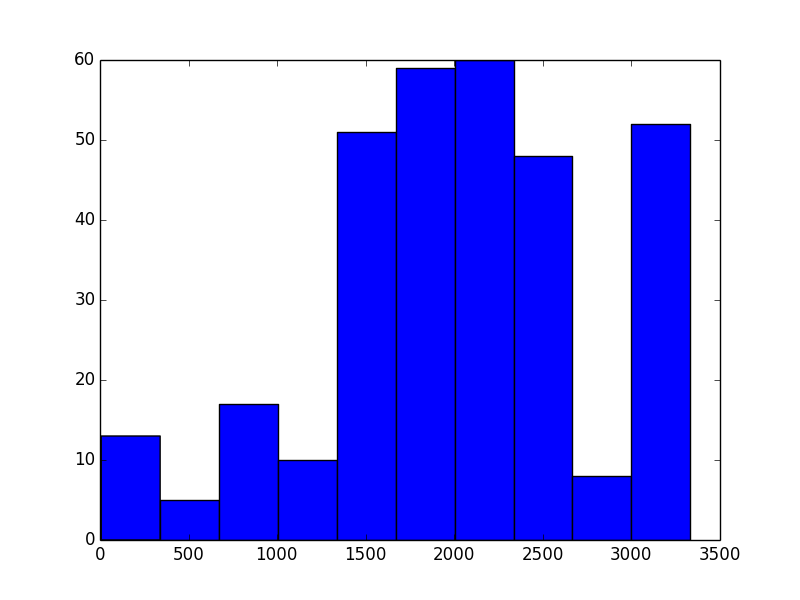
The GC times are pretty high. 2024 ms average with a 760 ms stddev.
I am looking at the trace-gc.log and cannot observe any pauses > 250ms (which are memory reducing GCs and bigger pause times are expected there).
Are you inspecting sums?
Ah, never mind. I was looking at 'Total time spent in GC' but that's the sum of all cycles, not total time for an individual GC cycle.
Maybe these logs are of more help, unfortunately the first part of the log got truncated due to the log size, but the captured time span covers multiple spikes.

trace-gc.log
homey-manager-system.memusage (11).txt
--max_old_space_size=256 --trace-gc --trace-gc-verbose --trace-incremental-marking58 remaining items


After updating from Node 8.4.0 to Node 8.7.0 (and thus V8 6.0 to 6.1), I noticed some significant changes in the memory profile of our application. There are a lot of spikes as if there is a periodic full garbage collect instead of smaller incremental sweeps. Is this intended behaviour?

Left side is 8.4.0, right side is 8.7.0.