A Plugin in FIJI/ImageJ for analysis of 3D confocal calcium imaging with cells appearing on multiple z-planes and exhibiting z-drift.
- Installation
- Description
- Input and Output File Organization
- Troubleshooting
Download the .jar file from the GitHub releases page. Install the plugin in FIJI (Plugins > Install) and restart FIJI.
The Plugin has the following 4 functions:
RENAME:
- Creates a copy of the files and changes the file name to a format compatible with ORGANIZE in a new folder with _r added. This requires a specific file structure as an input. Refer to the Input and Output File Organization section Organization Example A.
- An option to perform the ORGANIZE function simultaneously is available.
ORGANIZE:
- Makes a copy of the .tif files, turns them gray, and sorts them into new folders labeled by the z-positions. This requires a specific file structure as an input. Refer to the Input and Output File Organization section Organization Example C.
- An option to skip the grayscale function is available.
EXTRACT:
- Combines MEAN_INTENSITY values Mean_Intensity#.csv files from each neuron in the folder and outputs the POSITION_T.csv file in the python_files folder. This requires a specific file structure as an input. Refer to the Input and Output File Organization section Organization Example E.
- Subtracts the background, and finds the maximal value for each time point, and outputs Neuron#_subtracted_averages.csv and Neuron#_max_value.csv in the python_files folder.
- Calculates the change in fluorescence (∆F/F0) and plots the ∆F/F0 over time.
- Outputs the .csv files with the combined data and calculations, and a Neuron Plots folder containing the plots of the ∆F/F0 as .png files into the results folder. Refer to the Input and Output File Organization section Organization Example F.
- An option to perform MERGE is available.
- A Python version is available: https://github.com/hbai521/calcium_imaging/
MERGE:
- Combines all the ∆F/F0 values for each neuron in the folder into one file. This requires a specific file structure as an input. Refer to the Input and Output File Organization section and Organization Example G.
- Calculates the average and SEM of ∆F/F0 values and plots the average ∆F/F0 over time.
- Outputs merged_data.csv and Average_dF_F0.png into a merged_data folder within the results folder.
- A Python version is available: https://github.com/hbai521/calcium_imaging/
- The file folder name must be identical to the beginning of each file name in the folder. Organization Example C shows the input structure necessary. Note, if there is a comma in the name, the files must be renamed to not include one.
- ORGANIZE uses the Zeiss confocal file structure. Therefore, the files in the folder will have the same name as the folder with _h#t#z#c#.tif, (where the # stands for a number) at the end of each file to identify the phase (h#), time point (t#), z-position (z#), and channel (c#) of each file. In order for ORGANIZE to work, the original name of the folder must be kept, or if changed, the file folder name must be identical to the beginning of each file.
- For example, in the practice folder, files are saved as Neuron0to2_h#t#z#c#.tif, so the folder name is Neuron0to2.
- RENAME must be executed if the file name does not match Zeiss file structure for .tif files:
-
The files must be exported as .tif.
-
This function needs an input and order for all parts of a name in order to recognize the files.
- The filename, prefix, capitalization, digit count, post text, and order within the name of each variable are defined through the parameters.
- Then each file is copied and renamed to be compatible with ORGANIZE. As an example, Practice > renameNeuron0to2. These files are exported as renameNeuron0to2Z#T#ni.tif. The rename function would create a copy with the following name: Neuron0to2_r_t#z#.tif. See Organization Example A and Organization Example B.
- To follow this example, these are the inputs for the RENAME function.
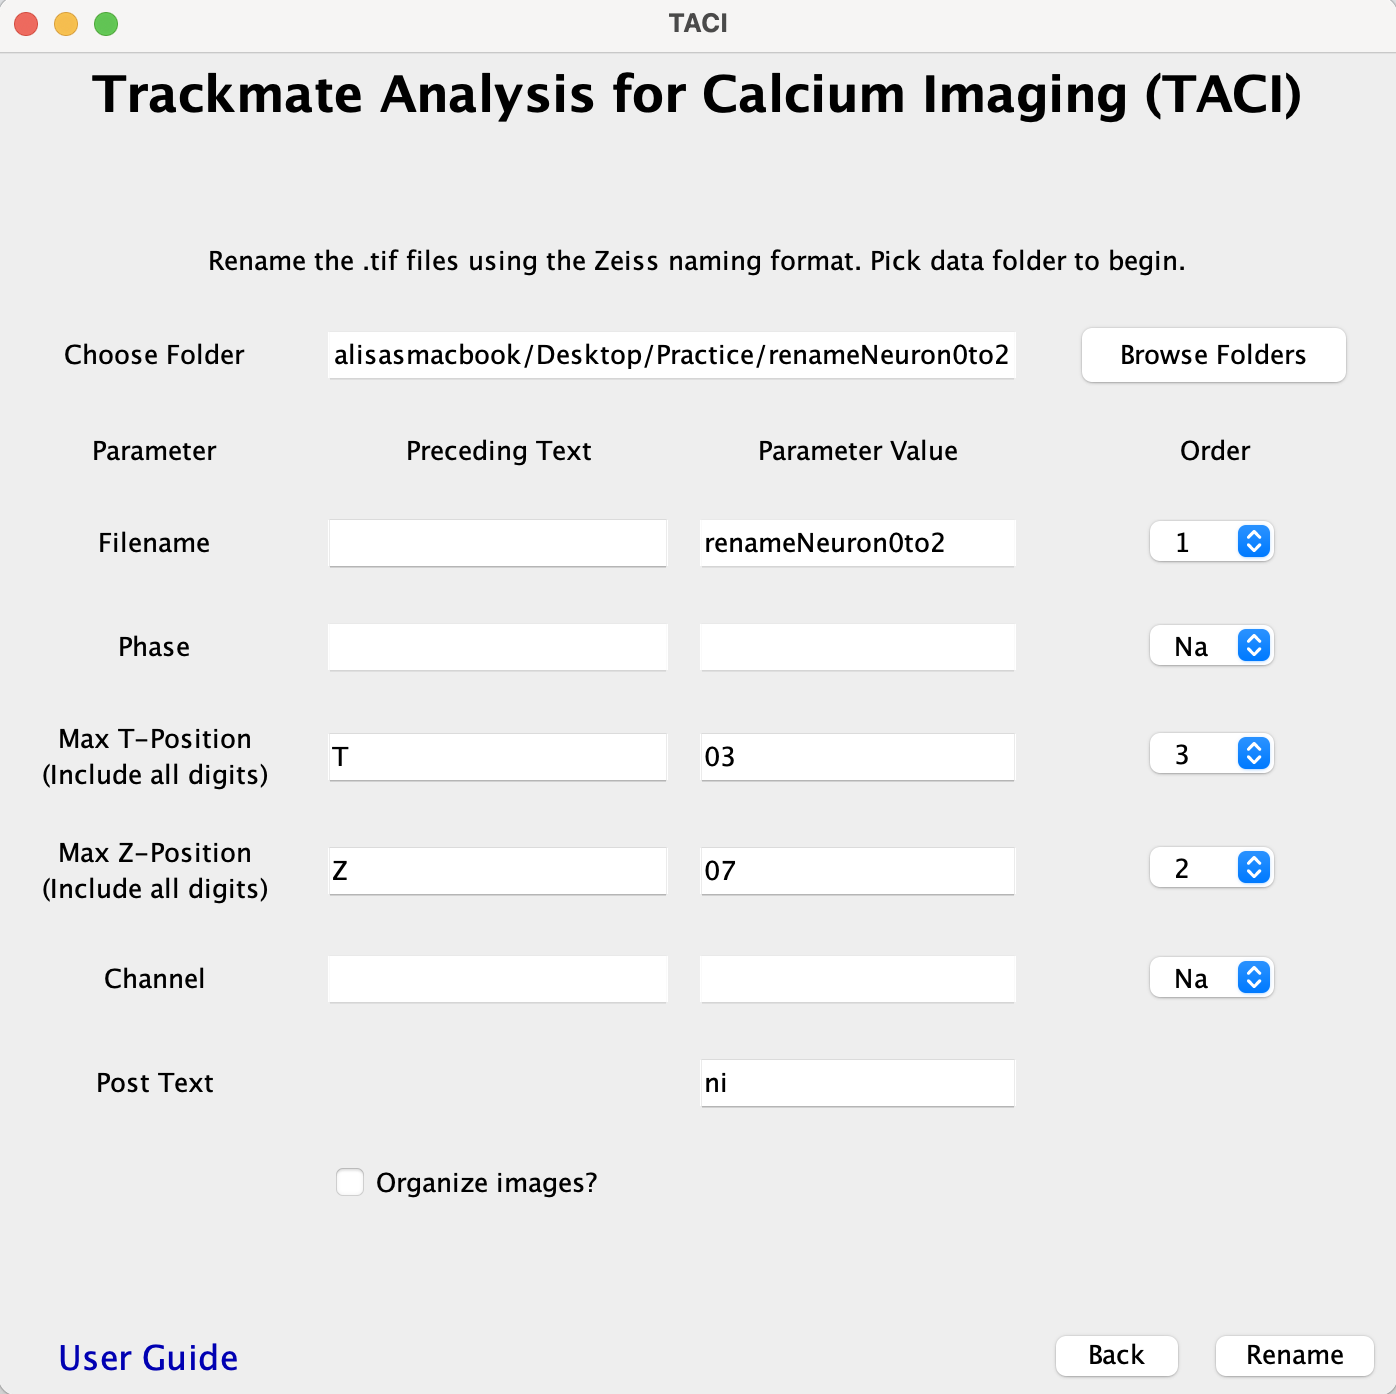
- RENAME Input Rules:
- File name is automatically filled in from the chosen folder. The order most often is "1"
- Phase
- The preceding text would include an _ and the parameter value should contain both the letter and number.
- e.g. in Neuron0to2_h01_t010_z07_c2_ni.tif the preceding text = _, parameter value = h01, order= 2.
- If there is no Phase, the order is set to Na
- Max T-Position
- The preceding text should include any _ and letter with the correct case.
- The parameter value should include all digits.
- e.g. in Neuron0to2_h01_t010_z07_c2_ni.tif the Max T-position preceding text= _t, parameter value= 010, order= 3.
- Max Z-Position
- The preceding text should include any _ and letter with the correct case.
- The parameter value should include all digits.
- e.g. in Neuron0to2_h01_t010_z07_c2_ni.tif the Max Z-position preceding text= _z, parameter value= 07, order= 4.
- Channel
- The preceding text would include an _ and the parameter value should contain both the letter and number.
- e.g. in Neuron0to2_h01_t010_z07_c2_ni.tif the preceding text= _, parameter value= c2, order= 5.
- If there is no Channel, the order is set to Na
- Post text
- If there is extra text after the Channel variable, enter the text here.
- e.g. in Neuron0to2_h01_t010_z07_c2_ni.tif, post text= _ni.
-
Note:
- The inputs are case sensitive. Make sure your case is correct.
-
├── Analysis
├── CalciumImaging1
├── CalciumImaging2
└── renameNeuron0to2
    ├── renameNeuron0to2_Z01T001ni.tif
    ├── renameNeuron0to2_Z01T002ni.tif
    ├── renameNeuron0to2_Z01T003ni.tif
    ...
    ...
    ...
    └── renameNeuron0to2_Z07T003ni.tif
├── Analysis
├── CalciumImaging1
├── CalciumImaging2
├── renameNeuron0to2
└── renameNeuron0to2_r
    ├── renameNeuron0to2_r_t01z01.tif
    ├── renameNeuron0to2_r_t01z02.tif
    ├── renameNeuron0to2_r_t01z03.tif
    ...
    ...
    ...
    └── renameNeuron0to2_r_t03z07.tif
- The files from the original folder are copied and saved into a new folder labeled with the file name and _gray_stacks one directory above (outside of the input folder) such that the original folder is never changed. For the example in Practice > CalciumImaging1 > Neuron0to2:
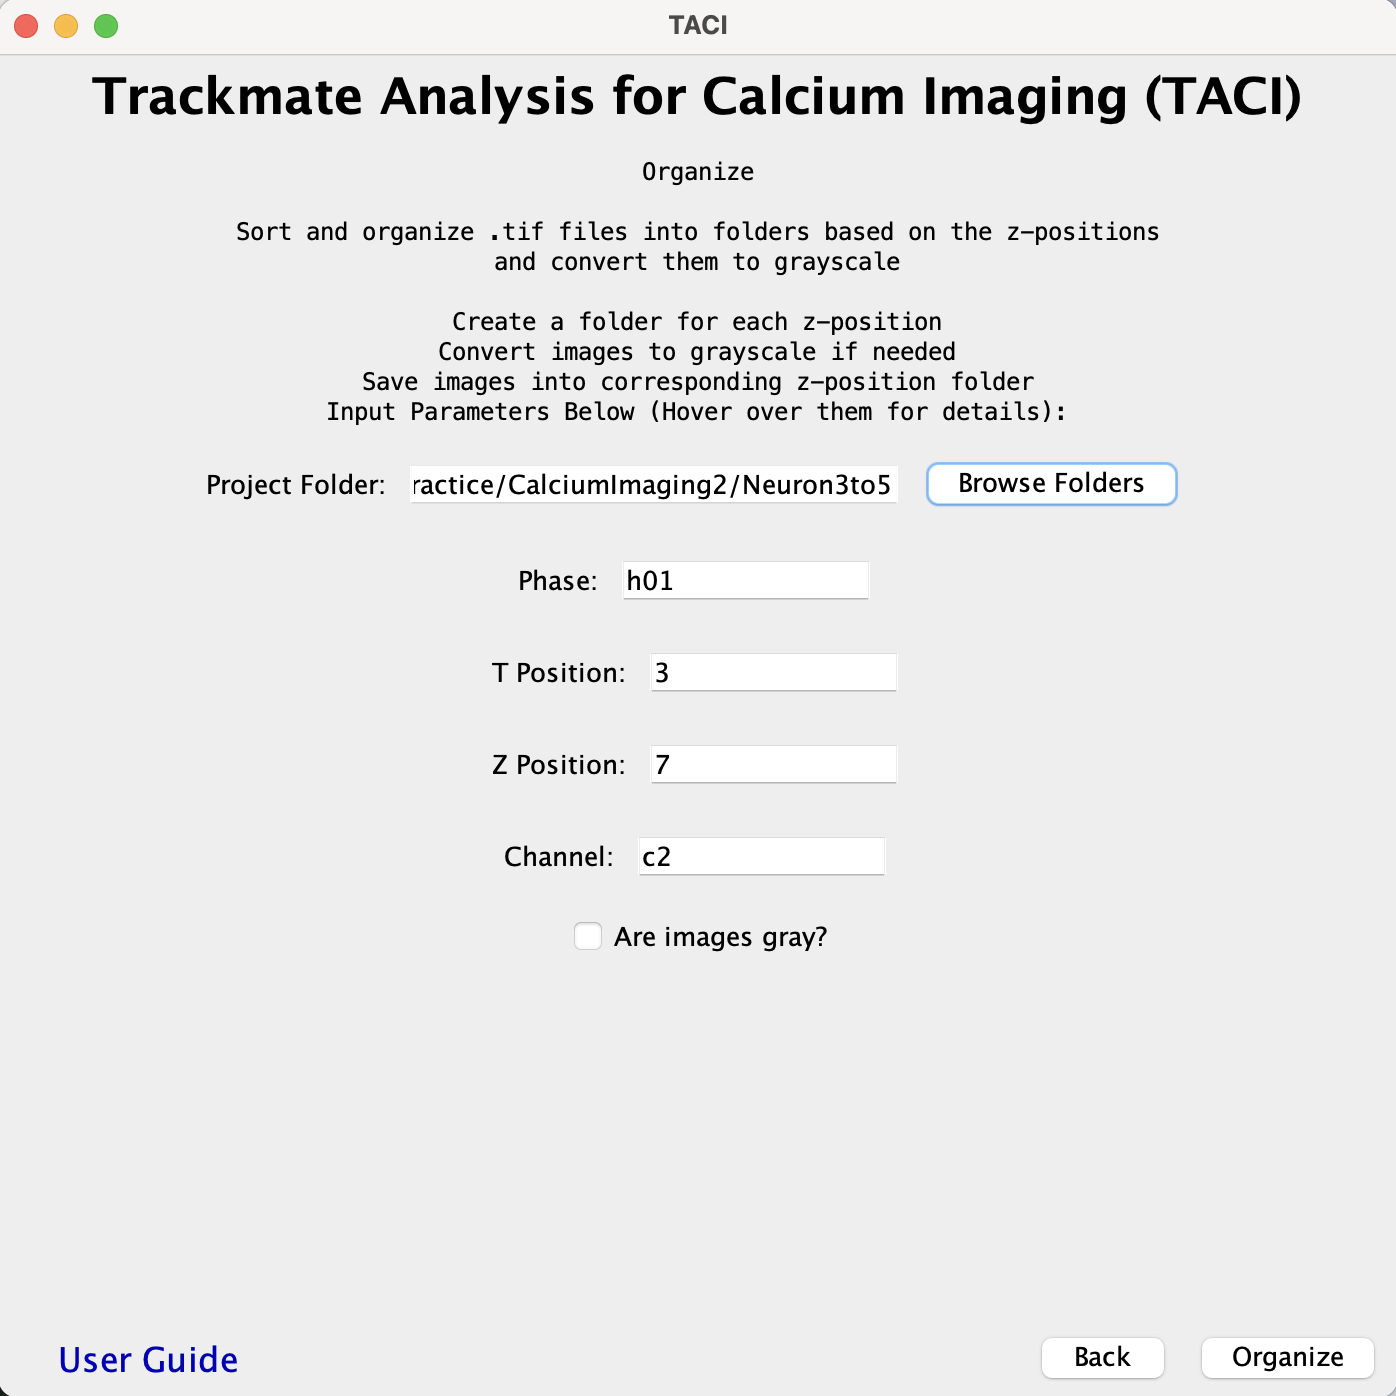
- The folder Neuron0to2 should be chosen from the menu without being entered.
- If there is a params.csv file, the parameters are automatically read. (Practice > CalciumImaging2 > Neuron3to5) example and is shown as an example in Params File.
- If there are no params.csv file, the phase, t-position, z-position, channel, and whether images are already gray must be indicated.
- If there is no phase or channel enter Na. There must be a numeric input for t-position and z-position.
- If the Are Images gray? box is unchecked a grayscale function is performed on the copies.
- After running the ORGANIZE function, a params.csv file will be generated, such that future runs have parameters filled in. -If parameters need to be changed, the existing params.csv file must be deleted for changes to apply. Alternatively, the params.csv could be edited directly to reflect the changes.
- In the output folder Neuron0to2_gray_stacks the z-position folders named Neuron0to2_1, Neuron0to2_2 etc. with the sorted gray files.
- Refer to Organization Example C for an example of how the files should be structured and Organization Example D for what the file structure looks like after execution.
- The following is the input example for Practice > CalciumImaging2 > Neuron3to5.
├── Analysis
├── CalciumImaging1
│   └── Neuron0to2
│   	├── Neuron0to2_h01t01z01c2.tif
│   	├── Neuron0to2_h01t01z02c2.tif
│   	├── Neuron0to2_h01t01z03c2.tif
│   	...
│  	...
│   	...
│   	├── Neuron0to2_h01t03z04c2.tif
│       └── Neuron0to2_h01t03z07c2.tif
├── CalciumImaging2
│   ├── Neuron3to5
│   └── params.csv
└── renameNeuron0to2
├── Analysis
├── CalciumImaging1
│   ├── params.csv
│   ├── Neuron0to2
│   └── Neuron0to2_gray_stacks
│       ├── Neuron0to2_1
│       │   ├── Neuron0to2_h01t01z01c2.tif
│       │   ├── Neuron0to2_h01t02z01c2.tif
│       │   └── Neuron0to2_h01t03z01c2.tif
│   	...
│   	...
│   	...
│       └── Neuron0to2_7
│           ├── Neuron0to2_h01t01z07c2.tif
│           ├── Neuron0to2_h01t02z07c2.tif
│           └── Neuron0to2_h01t03z07c2.tif
├── CalciumImaging2
└── renameNeuron0to2
- The params.csv file could be created before running ORGANIZE.
- The .csv file should have 5 columns with the following headers: filename, phase, position_t, position_z, channel, is_gray.
-
Each column must contain the parameters that are to be executed. For phase and channel, the prefix and number are included. If there is no phase or channel, Na is set. For is_gray, either Yes or No is set. For t_position and z_position, a number within the range of the files must be chosen.
-
A params.csv file is created after running ORGANIZE with the inputs given. If the inputs need to be changed, the params.csv file should be erased or altered to match.
-
The following is the params.csv file for Practice > CalciumImaging2 > Neuron3to5
filename phase position_t position_z channel is_gray Neuron3to5 h01 3 7 c2 No
-
-
The All Spots statistics (old FIJI version) or export (new FIJI version) .csv files from TrackMate should be saved in the following format:
- Mean_Intensity#.csv # stands for the number of the z-position where values come from.
- For example, TrackMate All Spots statistic or export file for z-position 3 should be saved as Mean_Intensity03.csv.
- This way, the mean intensity values in each z-position can be tracked by replacing the general MEAN_INTENSITY or MEAN_INTENSITY_CH1 column names with the file name Mean_Intensity# in the merged document.
- Mean_Intensity#.csv # stands for the number of the z-position where values come from.
-
The Mean_Intensity#.csv files for each neuron should be saved into a folder labeled Neuron #, where # stands for the number of the neuron.
- The first neuron in the set is always Neuron 0, the second is Neuron 1, etc. If running only one neuron, label it Neuron 0. Organization Example E and Organization Example F show an example of folder organization before and after execution respectively.
-
A Background_list.csv file must be present in the same folder as the Neuron # folders. It is automatically filled in the Plugin. See example in Background List File
-
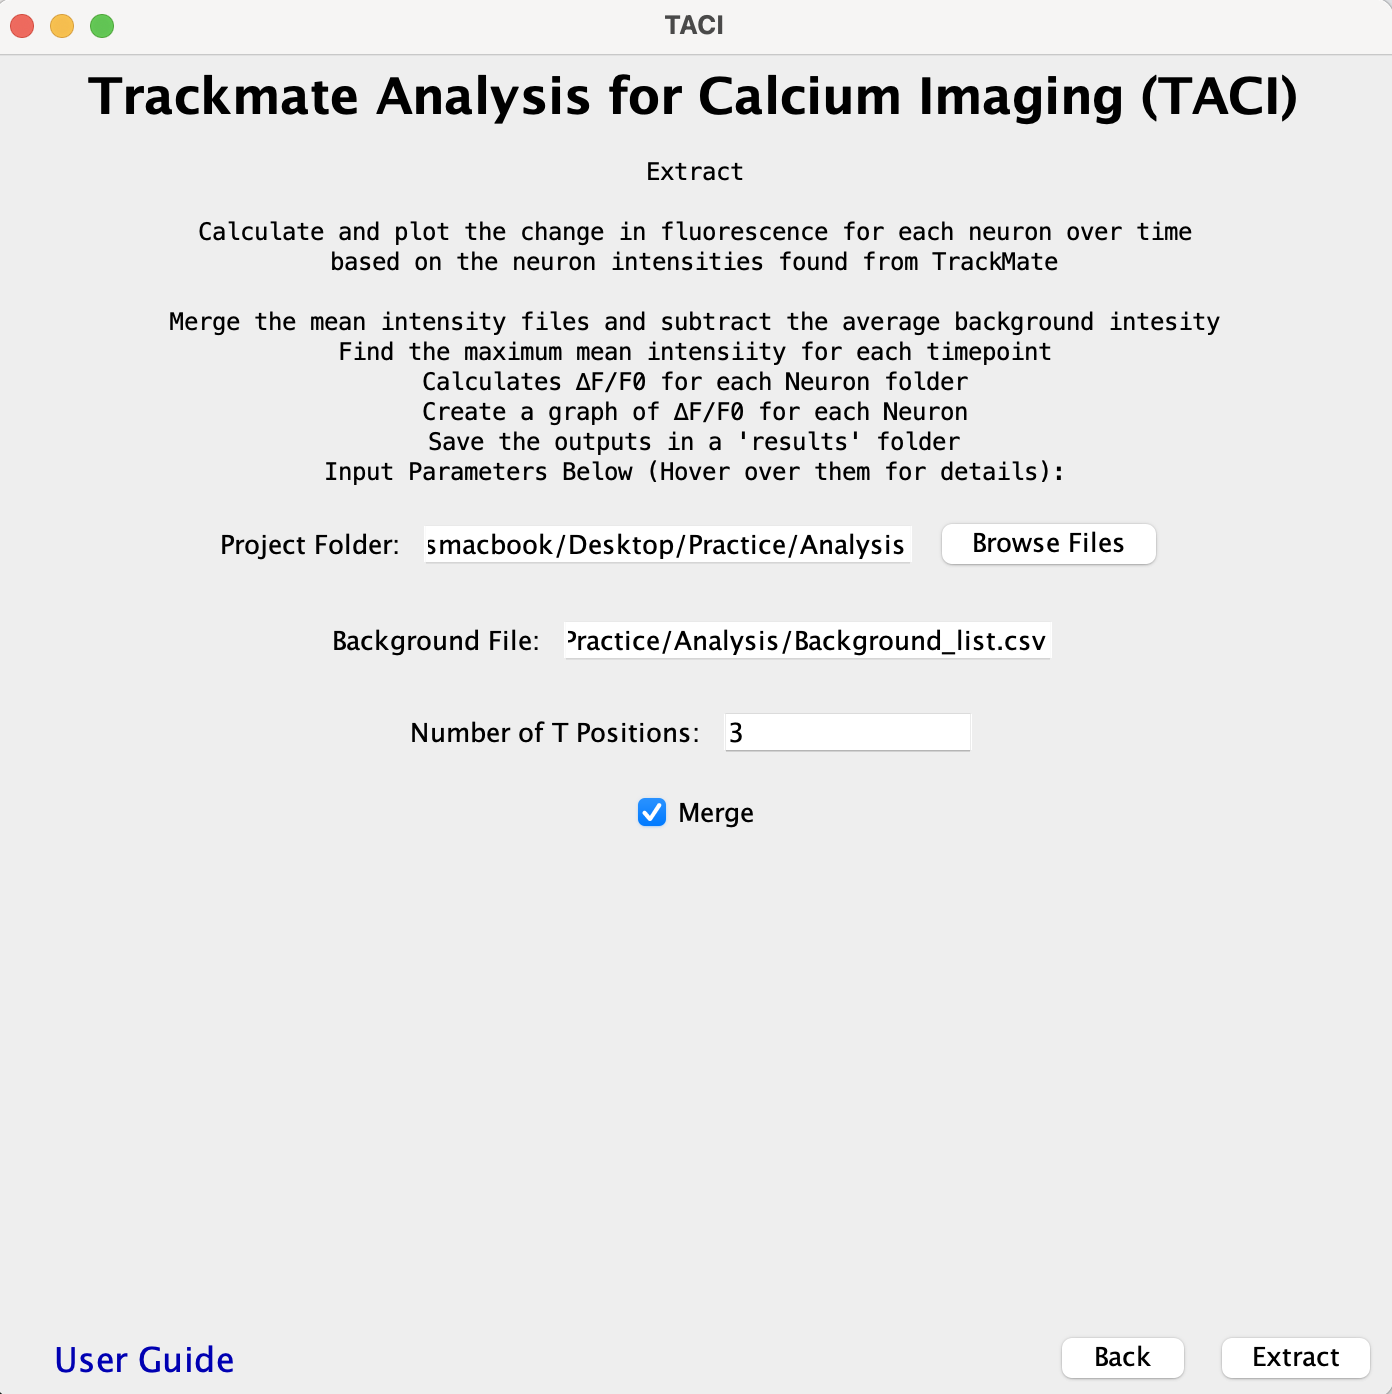
The EXTRACT function will combine the MEAN_INTENSITY/MEAN_INTENSITY_CH1 columns of the Mean_Intensity#.csv files in each Neuron # folder into one file, subtract the background, calculate the maximum intensity and the change of fluorescence (∆F/F0) over time for each individual neuron. Results will be saved to a results folder with the name Neuron #.csv. Plots for each neuron will be saved in the Neuron Plots folder under the results folder.
- The results folder is created in the directory where the Neuron # folders reside.
- In Organization Example E, the results folder would be created in the Analysis folder.
- Within the results folder, there are the .csv files with the merged mean intensity and the ∆F/F0 calculation labeled after each neuron.
- There is also a folder called Neuron Plots that will have the output plots for each ∆F/F0 value.
- One folder, Neuron 0 can be run if needed.
- The results folder is created in the directory where the Neuron # folders reside.
-
An option to perform MERGE is available.
-
The following is the input example for Practice > Analysis.
├── Analysis
│   ├── Background_list.csv
│   ├── Neuron 0
│   │   ├── Mean_Intensity_01.csv
│   │   ├── Mean_Intensity_02.csv
│   │   └── Mean_Intensity_03.csv
│   │	...
│   │	...
│   │	...
│   └── Neuron 5
│       ├── Mean_Intensity_04.csv
│       ├── Mean_Intensity_05.csv
│       ├── Mean_Intensity_06.csv
│       └── Mean_Intensity_07.csv
├── CalciumImaging1
├── CalciumImaging2
└── renameNeuron0to2
├── Analysis
│   ├── Background_list.csv
│   ├── Neuron 0
│   ├── Neuron 1
│   ├── Neuron 2
│   ├── Neuron 3
│   ├── Neuron 4
│   ├── Neuron 5
│   └── results
│       ├── Neuron 0.csv
│       ├── Neuron 1.csv
│       ├── Neuron 2.csv
│       ├── Neuron 3.csv
│       ├── Neuron 4.csv
│       ├── Neuron 5.csv
│       └── Neuron Plots
│           ├── Neuron 0.png
│           ├── Neuron 1.png
│           ├── Neuron 2.png
│           ├── Neuron 3.png
│           ├── Neuron 4.png
│           └── Neuron 5.png
├── CalciumImaging1
├── CalciumImaging2
└── renameNeuron0to2- The background values are entered into an excel file that is saved as a Background_list.csv in the same directory as the Neuron # folders.
- The excel file should have a column for each neuron labeled as “Neuron #”. Make sure there is no space after the number in the neuron, as the following "Neuron # " will show an error.
- Each column must contain the background values for the z-positions being analyzed.
- The number of background values must match the number of Mean_Intensity#.csv files in each neuron folder.
-
For example, in Practice > Analysis, Neuron 0 has 3 Mean_Intensity#.csv files, Neuron 1 with 4 Mean_Intensity#.csv, and Neuron 2 with 4 Mean_Intensity#.csv files.
-
The Background_list.csv would look like the following.
Neuron 0 Neuron 1 Neuron 2 Neuron 3 Neuron 4 Neuron 5 1.978 1.084 1.084 1.978 1.084 1.084 2.435 1.150 1.150 2.435 1.150 1.150 2.335 0.430 0.430 2.335 0.430 0.430 0.297 0.297 0.297 0.297
-
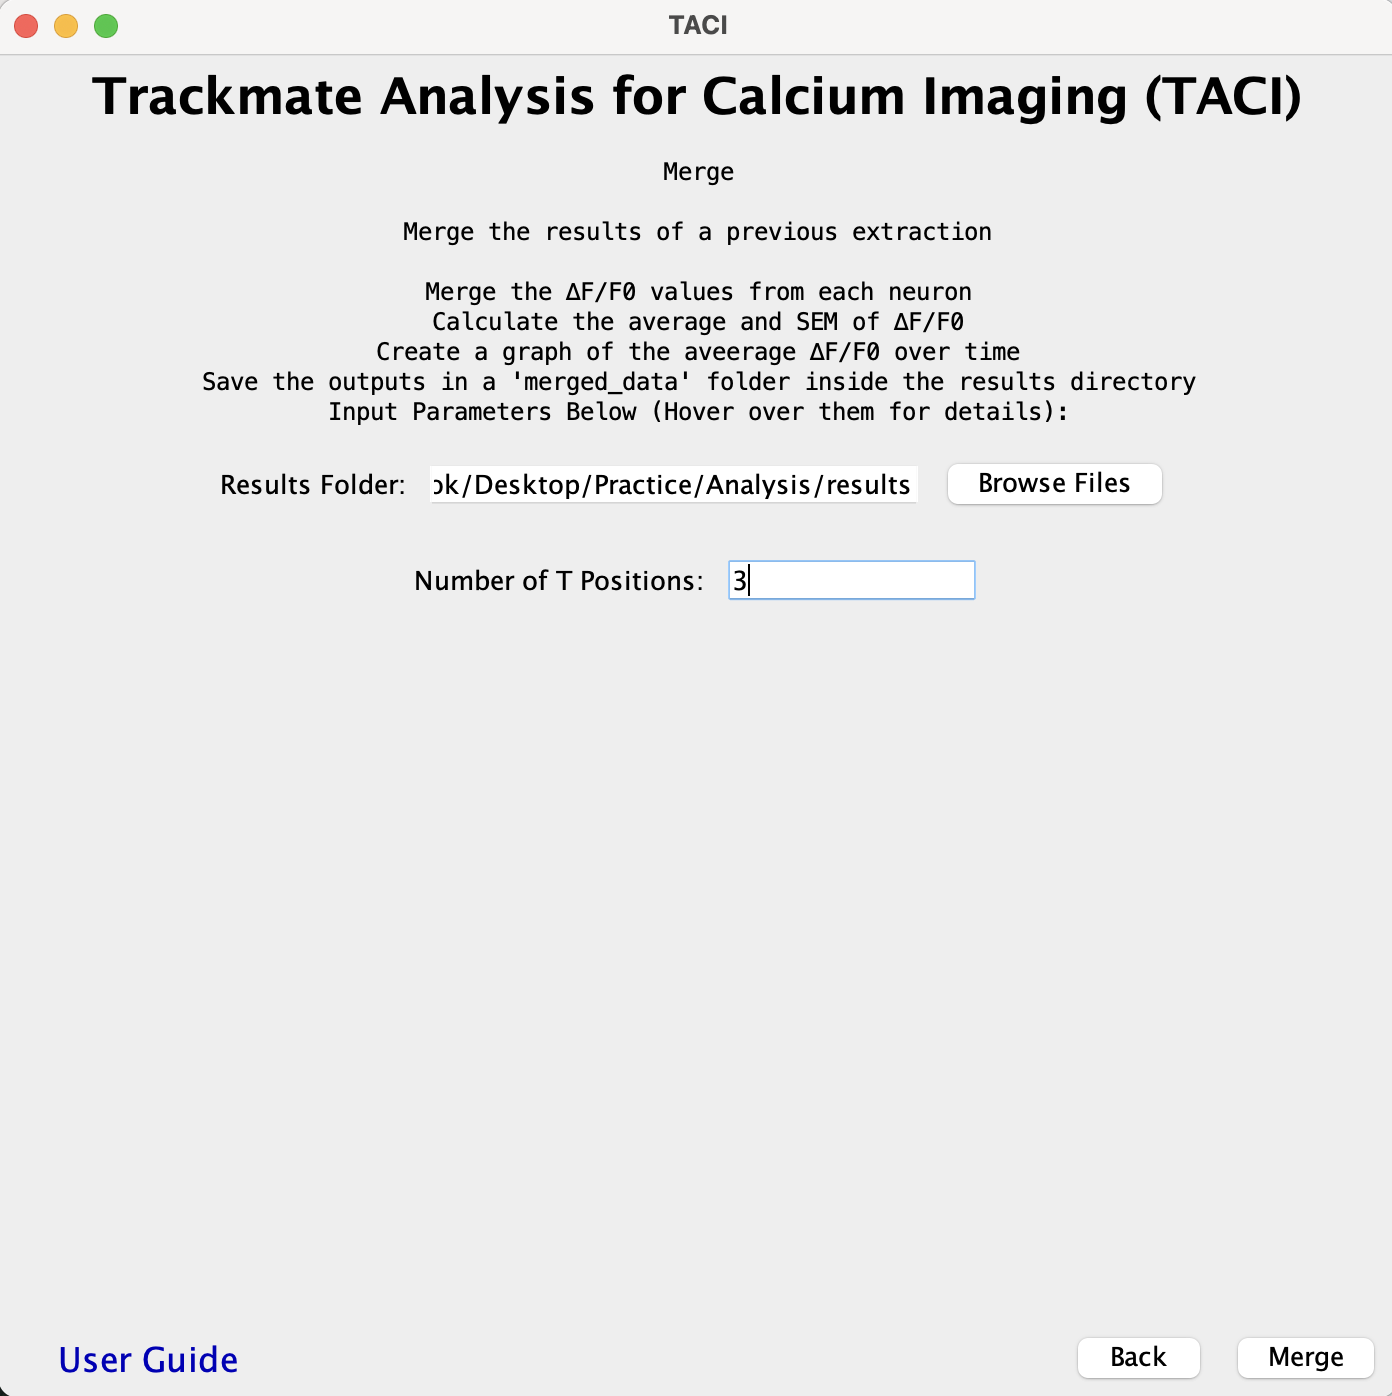
- The MERGE function combines all the ∆F/F0 columns from the Neuron #.csv files into one file and renames each column to match the Neuron #.csv file where it comes from. It then calculates the average and SEM of the ∆F/F0 columns. The file is named merged_data.csv and is saved into a new merged_data folder under the results folder as is shown in Organization Example G.
- This function also generates a graph named Average_dF_F0.png which plots the average ∆F/F0 of all neurons over time in the merged_data folder.
- All the Neuron #.csv files have to be in the same folder so the ∆F/F0 of each neuron can be averaged and plotted.
- The following is a Plugin input example for the results folder that would be created from Practice > Analysis > results
├── Analysis
│   ├── Background_list.csv
│   ├── Neuron 0
│   ├── Neuron 1
│   ├── Neuron 2
│   ├── Neuron 3
│   ├── Neuron 4
│   ├── Neuron 5
│   └── results
│       ├── merged_data
│       │   ├── Average_dF_F0.png
│       │   └── merged_data.csv
│       ├── Neuron 0.csv
│       ├── Neuron 1.csv
│       ├── Neuron 2.csv
│       ├── Neuron 3.csv
│       ├── Neuron 4.csv
│       ├── Neuron 5.csv
│       └── Neuron Plots
├── Neuron0to2
└── Neuron0to2_gray_stacks- Make sure to choose the correct folder. Do not enter the folder when choosing it. Just highlight it within it's enclosing folder.
- Make sure there is no comma in the file name.
- This analysis is case sensitive. Make sure the case is correct.
- Include any _ that are present in the file names. For example if the file name is Neuron0to2_t01_z01.tif both t-position and z_position inputs should have an underscore: _t and _z
- The number of digits, even if they are just 0's should be indicated for the max value. For example if this file shows the maximum t-position Neuron0to2_t010_z01.tif, the value for t_position should be "010". This is common with Nikon naming where there are more digits in the name than the maximum number of files.
- The channel and phase preceding text would not include the letter. Both the letter and value should be added into the parameter value column. Preceding text would include something like an underscore.
- Make sure that the order set matches the name.
- If there are missing files, the function will skip the files and state that files were missing.
- Make sure to choose the correct folder. Do not enter the folder when choosing it. Just highlight it within its enclosing folder.
- Make sure there is no comma in the name. If there is, either edit or make a params.csv file with the correct filename and proper parameters.
- Make sure the params.csv is correct.
- Make sure there are no missing any files.
- Make sure to choose the correct folder. Do not enter the folder when choosing it. Just highlight it within its enclosing folder.
- Make sure to change the Number of T Positions to the maximum value of t positions in your data.
- Make sure the Background_list.csv is correct for this set of data. The number of mean intensity files for each neuron must match the number of values for corresponding neurons.
- Make sure there are no spaces before or after "Neuron #". " Neuron #", "Neuron # ", and " Neuron # " will give an error.
- Make sure there are no empty values entered.
- Make sure the non-header cells in the Background_list.csv are formatted to numerical. Sometimes when values are copied and they do not have decimal points, they are not recognized as numbers under the cell format. This causes an error.
- Make sure to choose the correct folder. Do not enter the folder when choosing it. Just highlight it within its enclosing folder.
- Make sure to change the Number of T Positions to the maximum value of t positions in the data.