Minimalytics is a standalone minimalist analytics tool built on SQLite. Designed for resource-constrained environments, it provides a lightweight solution for tracking and visualizing event data with a minimal footprint. Whether you're tracking internal services or need a simple analytics tool, Minimalytics delivers performance without the bloat.
- Track Events: Record and monitor analytics for various events.
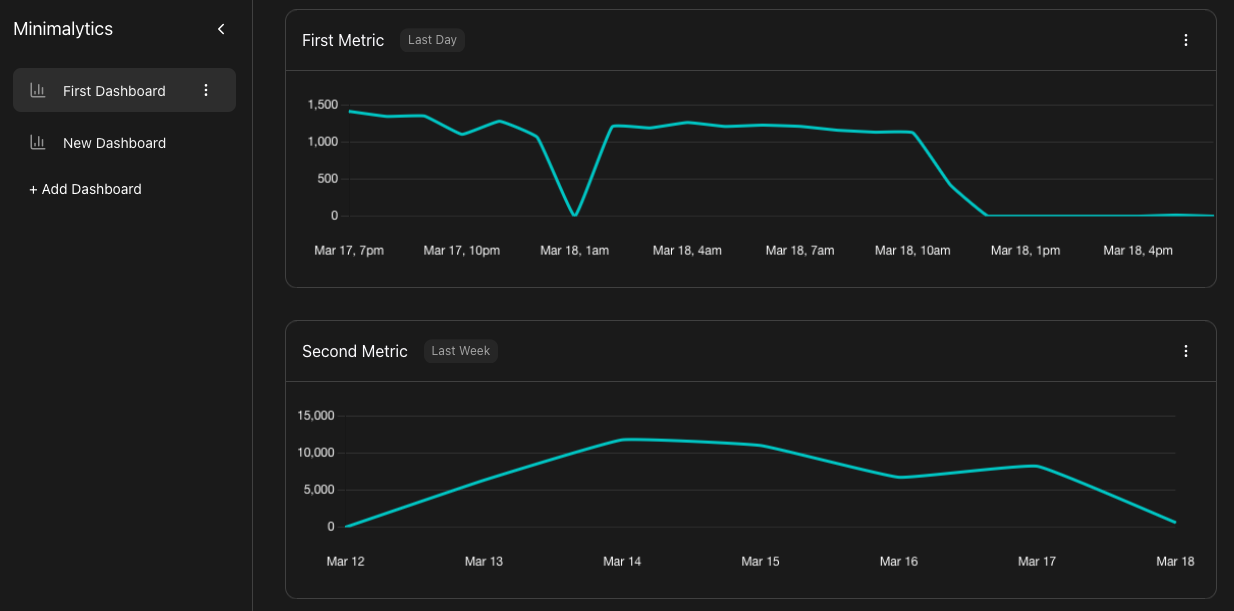
- Web UI: Manage dashboards and visualize event data with interactive graphs.
- Scalable: Supports over a billion events per month with a minimal storage footprint (~20 MB).
- Lightweight: Built with efficiency in mind, ensuring low memory and storage usage.
-
Clone the repository:
git clone https://github.com/nafey/minimalytics.git cd minimalytics -
Build the project:
go build -o build/minim . -
Install the binary system-wide:
sudo mv build/minim /usr/local/bin/
-
Check if the server is running:
minim status
-
Start the server:
minim server start
To record an event, send a POST request to the event API:
curl -X POST http://localhost:3333/api/event/ -H "Content-Type: application/json" -d '{"event": "<EVENT_NAME>"}'Replace <EVENT_NAME> with the name of the event you want to track.
-
Open your browser and navigate to:
http://localhost:3333/ -
Go to "First Dashboard" and click "Add Graph".
-
Select the appropriate properties and click "Done".
-
Your dashboard is now ready to display event data.
To disable access to the web dashboard, run:
minim web disableThis project was born out of the need for a lightweight analytics tool to track internal services on a resource-constrained VPS. Most SaaS analytics products either lack the scalability or exceed their free tier limits when tracking millions of events per month. Minimalytics addresses this gap by offering a minimalist, high-performance solution for resource-constrained environments.
- Event Aggregation: Minimalytics saves space by aggregating events, storing only aggregate features (e.g., total invocations per day) instead of individual events.
- SQLite Storage: Event data is stored in an SQLite file, initialized during the first run of
minim. - Server Hosting: The
minimCLI starts a server that:- Hosts the API endpoint for event submission.
- Serves the web UI (built using minimui and placed in the
staticfolder).
- Web UI: Source for the Web UI is available at minimui.
- Support for sum, avg, min, and max on event values.
- Improved UI/UX.
- Multiple metrics in the same graph.
- Additional visualizations: Bar Chart, Pie Chart, etc.
- User ID-based analytics: Funnels, cohorts, and more.
- Details on individual events.
- Hourly event resolution beyond 48 hours.
- Minute resolution beyond 60 minutes.
Contributions are welcome! If you'd like to contribute, please:
- Fork the repository.
- Create a new branch for your feature or bugfix.
- Submit a pull request.
Minimalytics is licensed under the MIT License.
Enjoy using Minimalytics! For questions or feedback, feel free to open an issue on GitHub.