Based on react-native-responsive-linechart,
Breaking changes with respect to v4:
- New dependency on
react-native-gesture-handler
Breaking changes with respect to v3:
- Support for data point visualizations
- Library supplied tooltip component is renamed from
BoxTooltipto justTooltip - Minor theme changes (box -> shape rename)
Additional features:
- Scrollable charts!


import { Chart, VerticalAxis, HorizontalAxis, Line } from 'react-native-responsive-linechart'

<Chart
  style={{ height: 200, width: '100%', backgroundColor: '#eee' }}
  xDomain={{ min: -2, max: 10 }}
  yDomain={{ min: -2, max: 20 }}
  padding={{ left: 20, top: 10, bottom: 10, right: 10 }}
>
  <VerticalAxis tickValues={[0, 4, 8, 12, 16, 20]} />
  <HorizontalAxis tickCount={3} />
  <Line data={data1} smoothing="none" theme={{ stroke: { color: 'red', width: 1 } }} />
  <Line data={data2} smoothing="cubic-spline" theme={{ stroke: { color: 'blue', width: 1 } }} />
</Chart>

const data1 = [
  { x: -2, y: 1 },
  { x: -1, y: 0 },
  { x: 8, y: 13 },
  { x: 9, y: 11.5 },
  { x: 10, y: 12 }
]

const data2 = [
  { x: -2, y: 15 },
  { x: -1, y: 10 },
  { x: 0, y: 12 },
  { x: 1, y: 7 },
  { x: 8, y: 12 },
  { x: 9, y: 13.5 },
  { x: 10, y: 18 }
]import { Chart, VerticalAxis, HorizontalAxis, Line } from 'react-native-responsive-linechart'
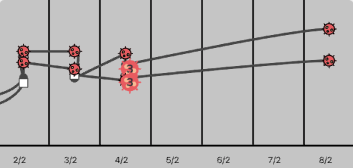
<Line
alwaysShowAllToolTips={false}
data={data1}
pointIconForPoint={data1}
theme={{
stroke: { color: 'rgba(22,22,22,0.0)', width: 1 }, // line are set to transparent here
scatter: {
default: { width: 8, height: 8, rx: 4, color: '#44ad32' },
selected: { color: 'red' },
},
}}
/>
const data = [
{ x: -2, y: 1 },
{ x: -1, y: 0 },
{ x: 8, y: 13 },
{ x: 9, y: 11.5 },
{ x: 10, y: 12 }
]
const data1 = [
{ x: -2, y: 1, icon: <<svg icon here>> },
{ x: -1, y: 0, icon: <<svg icon here>> },
{ x: 8, y: 13, icon: <<svg icon here>> },
{ x: 9, y: 11.5, icon: <<svg icon here>> },
{ x: 10, y: 12, icon: <<svg icon here>> }
]Version 3 is a complete re-write from the ground up with the following exciting features:
- Completely written in Typescript
- Composable API, every part of the chart is its own component.
- Very few dependencies (Total package size is only 62 kilobytes)
- New documentation website with extensive examples
- Support for smooth/linear line & charts area charts, tooltips and more
Due to the nature of the changes, version 2.2 and below is now no longer supported. You can find the old README here.