Skip to content
/ lesley Public

Lesley is a lightweight Python package designed to create interactive, github-style, calendar-based heatmaps using altair.

Notifications You must be signed in to change notification settings

mitbal/lesley

Folders and files

NameName
Last commit message
Last commit date

Latest commit


History

84 Commits


Repository files navigation

Lesley

PyPI Downloads

example workflow

Lesley is a lightweight Python package designed to create interactive, github-style, calendar-based heatmaps using altair.

Example Usage

Plot github-style heatmap

dates = pd.date_range(start='2024-01-01', end='2024-12-31')
values = np.random.randint(0, 10, size=len(dates))
lesley.cal_heatmap(dates, values)

github-styled calendar heatmap

Plot empty calendar

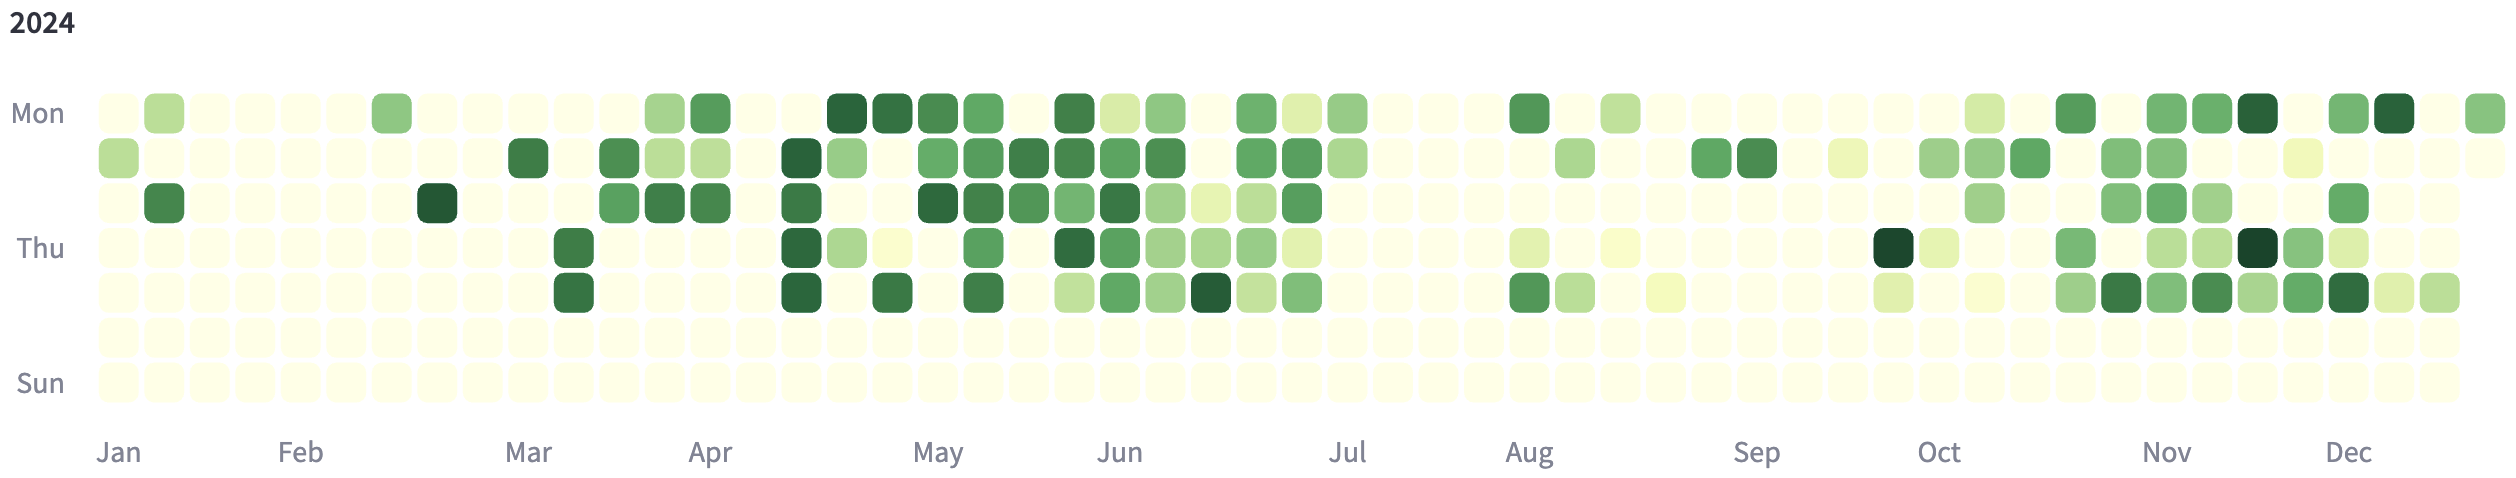
lesley.plot_calendar(year=2025)

empty full year calendar

Plot calendar with marker and label

holiday_df = pd.read_csv('holidays.csv') # need at least 2 columns: date and label
lesley.plot_calendar(year=2025, label_df=holiday_df, color='Oranges')

full year calendar with label and marker

Plot calendar heatmap

dividend_df = pd.read_csv('dividend.csv') # need 3 columns: date, label, and value
lesley.plot_calendar(year=2024, label_df=dividend_df, color='Greens', layout='2x6')

full year calendar heatmap

Plot individual month

dates = pd.date_range(start='2024-01-01', end='2024-12-31')
values = np.random.randint(0, 10, size=len(dates))
lesley.month_plot(dates, values, 1)

single month plot

About

Lesley is a lightweight Python package designed to create interactive, github-style, calendar-based heatmaps using altair.

Resources

Stars

Watchers

Forks

Packages

No packages published