Repository navigation
Run debug with a single command/click #244

Description
Activity
Can't make any promises but i'll investigate how to make this easier for you.
Can't make any promises but i'll investigate how to make this easier for you.
Thanks! Meanwhile, I am also researching online if that is possible.
It is sad that VSCode has this built-in setting called auto attach , but that is only applicable to node.js. There is also an extension for .net called .Net Auto Attach. But none exist for gradle.Do you need to start the java process with that gradle task? Can you create a launch file that executes the java main class instead? Typically this is how I debug my java apps.
Hi, prior to using vscode-gradle, I can debug java in a single click using launch.json. Thanks to the vscode-java extension pack. I am able to make the execution stop at my breakpoint and step thru the codes.
However I suspect that this does not goes thru Gradle. Cos if it goes thru Gradle to build my application, the build class would have been inside the build folder. But instead, it goes to the bin folder.
That is why I prefer using the vscode-gradle to help me build and run app (in debug mode) via Gradle. But that would also mean I need to execute a 2nd step as described in my first post in order for execution to stop at the breakpoint.
I've done some investigation around this.
This seems to work nicely (for example):
./gradlew run --debug-jvm
...as it suspends execution until the debugger is attached.
I've attempted to do something similar by providing Java Debug Wire Protocol (JDWP) JVM args when running the task via the gradle server. This seems to do what we expect from the Java side (I see a process assigned to the debug port), and vscode can successfully attach to the process, but breakpoints are not being hit, and i'm not entirely sure why. It could be because the task is run in the context of the gradle server process, but i'm not sure yet. Will keep investigating...
[edit] nevermind, i was setting the gradle process jvmArgs 🤦♂
Ok after doing some more investigations and a whole lot of trial and error, I think I might have a plan to get this to work:
- If the gradle task implements the
org.gradle.process.JavaForkOptionsinterface, for example,testorrun, the show a "debug" icon in the tree view (also add a "debug" option to context menu). - When running a task in debug mode, we need to set the
jvmArgsto utilise the Java Debug Wire Protocol (JDWP). Although I'm not really happy with this approach, we can use the setEnvironmentVariables API to setJAVA_TOOL_OPTIONS=-agentlib:jdwp=transport=dt_socket,server=y,suspend=y,address=5005(we can also make the port configurable)- If the task configuration already has
jvmArgsset with an address that does not match the address set in theJAVA_TOOL_OPTIONS, then you'll get the following error:ERROR: Cannot load this JVM TI agent twice, check your java command line for duplicate jdwp options. Error occurred during initialization of VM agent library failed to init: jdwpTypically though, if you're debugging the gradle task via the extension, you would not be setting jdwp options in the task config. It would be great if I could figure out how to check if jdwp options have already been set, and if so prevent setting them again viaJAVA_TOOL_OPTIONS, so that the user can define the debug settings themselves in the gradle task config. - Alternatively, we don't set any jdwp options via JAVA_TOOL_OPTIONS, we expect the user has set debug options via task config (as demonstrated by OP), but it would be useful IMO if we don't expect users to this themselves.
- If the task configuration already has
- After the task is run we can then start the debugging using the startDebugging API.
When making changes to files, you'll need to either stop the debugging session and restart it (by clicking on the
debugicon again) or just use the "Hot Code Replace" feature of the java debugger.- If the gradle task implements the
- If the gradle task implements the
org.gradle.process.JavaForkOptionsinterface, for example,testorrun, the show a "debug" icon in the tree view (also add a "debug" option to context menu).
Really thanks you for the effort in the investigation of this. I greatly believe users would love it, if the debug menu option is implemented.
Personally for me, it is perfectly ok for me to manually set the debug options in the build.gradle (which is what i done as described in my first thread),, but of course, it would be fantastically great if u have a way to check if user has manually defined that in the build.gradle and give it a default if the user has not.
- If the gradle task implements the
Thanks for the feedback.
It doesn't look like I can read task config/options through the gradle tooling api. See GradleTask.
I also cannot determine whattypeof task is being debugged (eg to figure out if it extends from JavaExec) - to get around this I might just need to limit the debug feature to tasks that belong to groupsapplicationortest.
I'll continue investigations before deciding on a first version.I'm making some progress on this and will have a PR ready soon.
Here's how the first version will work.
Setting up debugging via Gradle Tasks
- You define the launch configuration within
.vscode/launch.json, for example:
{ "configurations": [ { "type": "java", "name": "Debug (Attach) via Gradle Tasks", "request": "attach", "hostName": "localhost", "port": 6565 } ] }- You define the Gradle debug options within
.vscode/settings.json:
{ "gradle.javaDebugOptions": { "enabled": true, "launchConfig": "Debug (Attach) via Gradle Tasks", "tasks": [ "run", "runBoot", "test", "intTest", "integration", "subproject:someOtherTask" ] } }- A "debug" icon will now appear next to the tasks defined in
gradle.javaDebugOptions:
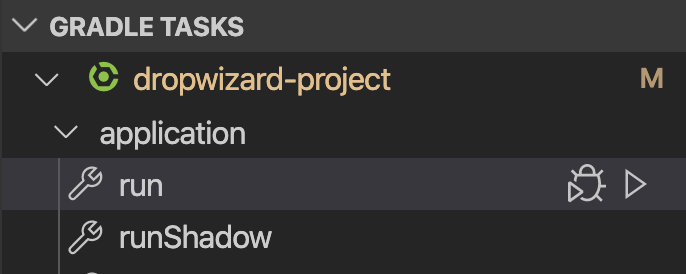
- When you click on that debug icon, the Gradle task is run with debug jvmArgs, via the
JAVA_TOOL_OPTIONSenvironment variable:
-agentlib:jdwp=transport=dt_socket,server=y,suspend=y,address=6565
The Gradle task Java process is suspended and waits for the debugger to attach to it.
-
The extension waits for the debugging port to be open on
tcp:6565 -
Once the port is open, the vscode Java debugger is attached to the Java process using the config specified in the launch configuration
-
The Java execution continues and you can debug the execution as normal with breakpoints etc.
(in all cases above, the port is dynamic and specified by your launch config)
Once this config is setup, it's only 1 step to debug your Java via Gradle Tasks: Just click on the debug icon.
Limitations
I've got the above running and it seems to work pretty well, although I can't accommodate different debugging scenarios without making this feature hugely complex. I want to keep it simple, thus there's some limitations.
- The user might have set debug jvmArgs within the gradle task configuration. This could cause Java errors. In this case the user will need to remove the jvmArgs in their gradle task config.
- (There's probably other limitations i'm not aware of right now)
hanct would this work for you? any suggestions on improving this workflow? i'm happy to go with this for now, and iterate to improve the workflow in the future.
- You define the launch configuration within
Hi,
Thanks for the enhancement! For the limitations, I definitely won't mind removing the jvmArgs in the gradle task config. :)Once the above enhancement is implemented and assuming the configurations for settings.json and launch.json are done, so i just do the below 2 steps:
- Click on debug icon beside the gradle task (e.g, run) in the gradle tasks pane
- Run the configuration set in the launch.json
Is my understanding correct?
Assuming my above understanding is correct, if i modify my codes and wanna test again, do i have to stop the running gradle task( run), and repeat the above 2 steps again in order to debug my modified codes?
Once the config is setup, you'll only need 1 step, which is to click on the debug icon. The Gradle task is run and the debugger is started in the same step.
For the second question, conceptually yes, you need to restart the process. You need to recompile the Java. This means stopping and starting the task again. To help with this, I might add a "restart" icon to do this in one step.
Keep in mind, you don't need to stop/start the process when you change code, instead you can take advantage of the "hot code replace" feature of the java debugger (the icon on the right), where you don't need to restart the process (but doesn't always work):
ok. noted on this! Really excited to try out this new enhancement u gonna implemented.
Also the "restart" icon is definitely a welcome feature!And thanks for the tip on the "hot code replace" feature. I have tried out this feature before, with gradle involved. But does not seem to work. So i thought it can only works only when gradle is not invovled.
But i will try that again, cos as what u mentions "it doesn't always work".Latest update: Oops sorry, I try the "hot code replace" feature with gradle involved, and yes its working now. Not sure y it isn't working previously..
Reacted by Richard WillisThis feature is nearly ready to release with PR #298. I'm just dealing with some failing integration tests in windows. I'll fix them and release this feature tomorrow.
In the meantime you can have a read of how the feature will work here: https://github.com/badsyntax/vscode-gradle/blob/c783fa10613134e4cd24545fb3deeff0a64c80d3/README.md#debugging-javaexec-tasks
As you can see I've removed the requirement of manually defining the launch configs.I'll update this issue when the feature is released.
Reacted by HansterThis feature is now released with version 2.7.0. Can you update and give it a go? Let me know if there are any issues. Thanks!
Just tested. i encounter similar error as what is raised under #301
So now pending for newer update to VSCode-gradle extension...Cool, thanks for testing & letting me know. I'll release that fix sometime today. In the meantime I've added a gif showing how it should work: https://github.com/badsyntax/vscode-gradle/blob/master/README.md#debugging-javaexec-tasks
I've released the fixes with version 2.7.1. It seems to be working for me on Windows 10 now.
Can you try, and let me know if there are any issues? Thanks!Bravo! Thanks. No issue now. It works perfectly for my use case.
Reacted by Richard Willis


Extension Name: vscode-gradle
Extension Version: v2.4.13
OS Version: Windows 10
VSCode version:1.43.2
Current Situation:
I am able to debug spring boot application (or any java-based application) in vscode by doing the below 2 things
Run the gradle task called bootRun. Note that the build.gradle is configured with this
bootRun {
jvmArgs=["-agentlib:jdwp=transport=dt_socket,server=y,suspend=y,address=32323"]
}
With the below configured in the launch.json, run the configuration to attach the debugger to the listener port 32323.
{
"type": "java",
"name": "Debug (Attach1`)",
"request": "attach",
"hostName": "localhost",
"port": 32323
}
Finally, i can see my vscode break at my custom breakpoint in the code editor.
However, everytime i make a changes to the Java code, i have to stop everything above, and rerun the 2 steps. It is really tedious. Is there a way to run the above 2 steps with just one single command or a single button click.