- Team Members:
- Link to the tableau Workbook: https://public.tableau.com/profile/shaima3352#!/vizhome/ProjectR2/Summary
- Link to the website the dashboard and story published in: https://mesha4545a.github.io/tableauProject.github.io/
Hobe we did a good job
Taxi Dataset from Thursday Presentation: https://drive.google.com/file/d/1CPGe0GYfItlQK86XJX3XqnuI0CNV5hAI/view?usp=sharing
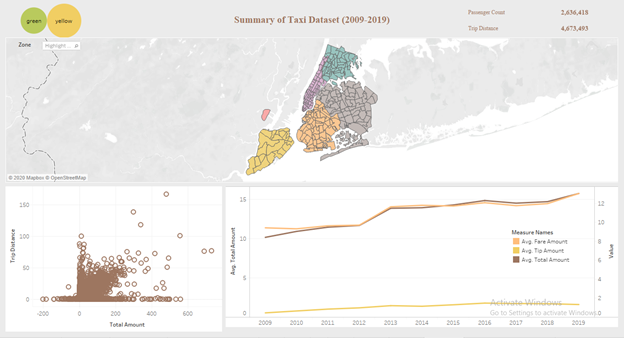
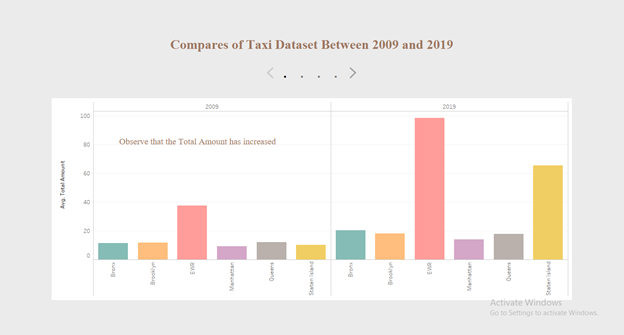
The period of the dataset we used is from 2009-2019 and there are one types of taxis, yellow cab.
when we were looking at the data we find that the total amount has null values so we applied a filter before using the that the reason we used the filter and not the interrupter is the data size when we use the interrupter the computer crashes so we decided on using a filter instead
- AVG(Total Amount): shows total price
- AVG(Fare Amount): shows fare price
- AVG(Tip Amount): shows the tip amount
- AVG(Passenger Count): shows number of passengers
- CNT(Vendor id): shows number of raides
- SUM(Trip distance): Show total trip distance
- SUM(Passenger Count): Show total number of passenger
- SUM(Total Amount): Show total fair amount