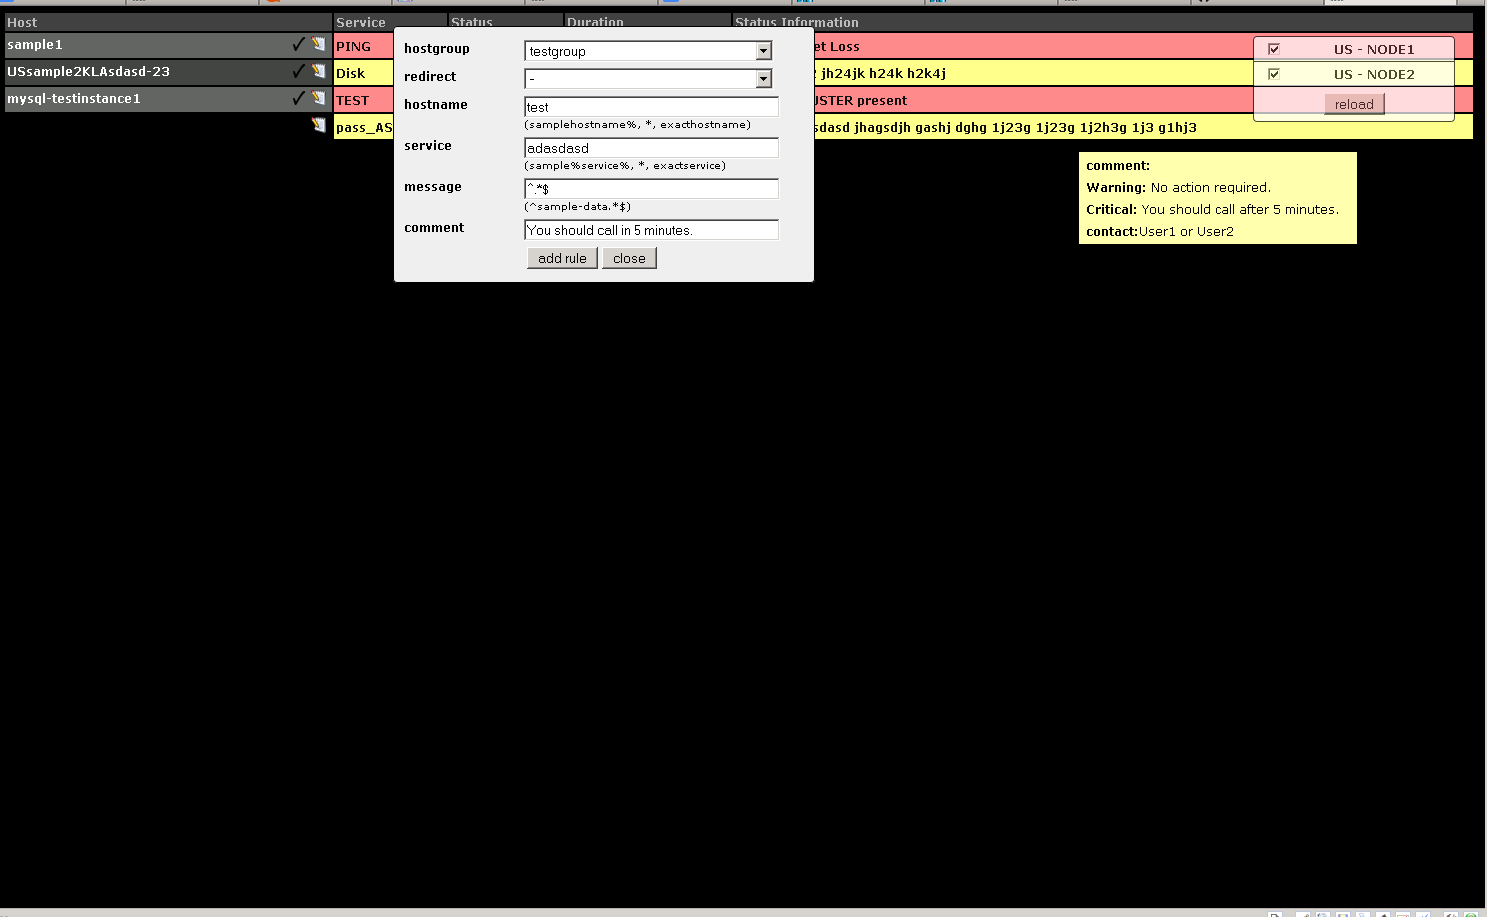
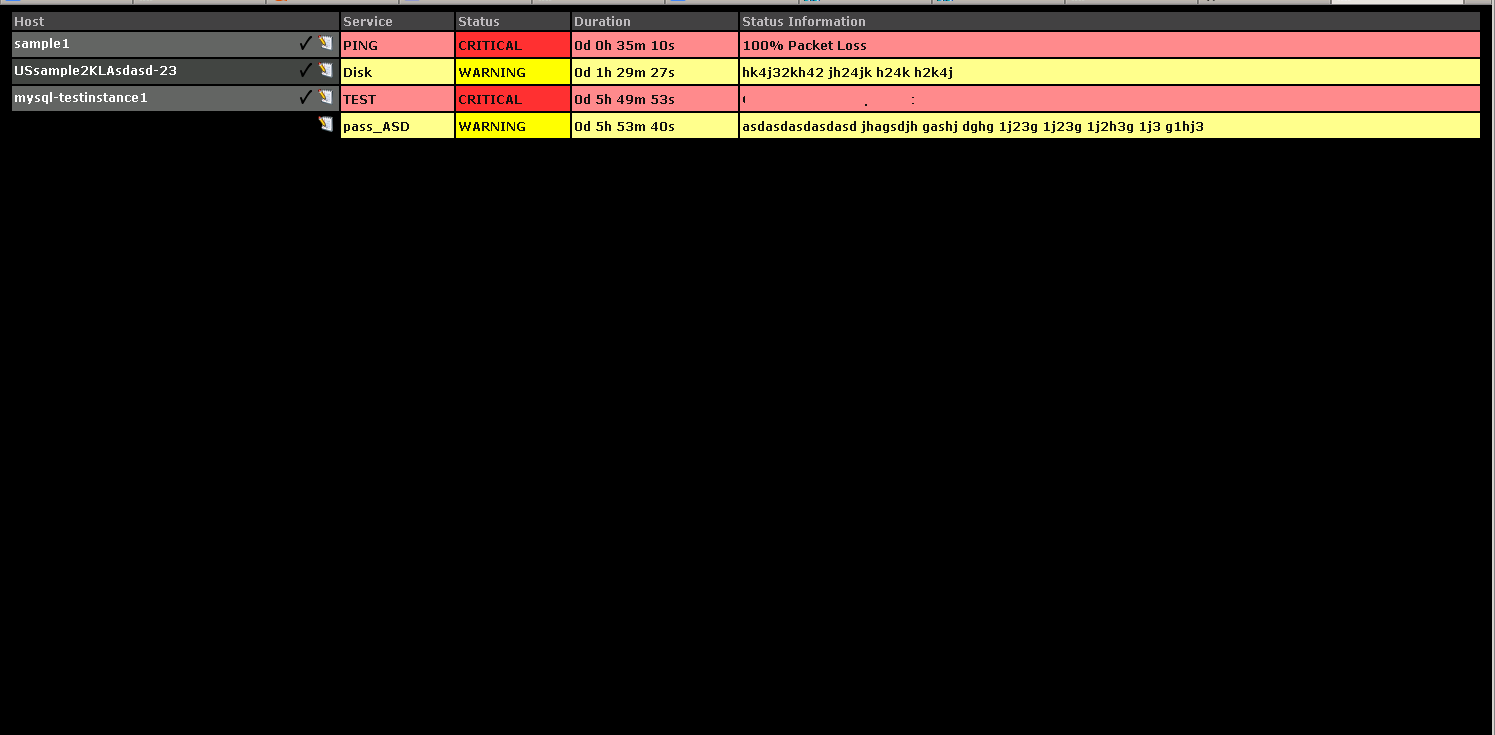
Nagios Status to JSON/JSONP/Console.
- Everything should be automatic. It tries to find the nagios configuration and locate the status.dat and parse it. If something is wrong or you are using exotic nagios configuration, you can set the statusdat as a parameter.
- It works on Linux and BSD also.
- The parser is much faster than the built-in nagios parser. (Using the nagios cgi scripts the parsing takes 3+ seconds. With this It takes ~0.1s)
I am using this as a backend for my nagios aggregator front-end. So with this you can aggregate multiple nagios instances.
- make/gmake for makefile
- c++ compiler
- gmake / make
- copy the binary to the nagios cgi directory
user@monitor1:~$ /mnt/data/nagios/sbin/nagios2json.cgi
example1          | PING                 | CRITICAL |  12d 3h 11m 8s   | "PING CRITICAL - Packet loss = 100%"
example2          | PORT-80              | CRITICAL |  18d 7h 44m 45s  | "Connection refused"
user@monitor1:~$ curl http://monitor1/nagios/cgi-bin/nagios2json.cgi?servicestatustypes=28&serviceprops=...
{
"version":20110619,
"running":1,
"servertime":1409075862,
"localtime":[1,7200],
"created":1409075855,
"data":
[
    {
    "last_state_change": 1409075855,
    "plugin_output":"PING CRITICAL - Packet loss = 100%",
    "status":"WARNING",
    "flags":1485146,
    "hostname":"examplehost",
    "service":"PING",
    "host_alive":1,
    "services_total":10,
    "services_visible":1,
    "duration":"0d 0h 0m 0s"
    }
]
}

You can add &callback=FNNAME for JSONP
  -s, --status=[FILE]          nagios status.dat path
  -c, --cgi                    cgi mode
  -j, --json                   json output
  -t, --servicestatustypes     service status type (OK/CRIT/WARN)
  -p, --serviceprops           service props (ACK/MAINTENANCE)
  -n, --hostprops              host props (ACK/MAINTENANCE)
hostprops:
HOST_SCHEDULED_DOWNTIME                  1
HOST_NO_SCHEDULED_DOWNTIME               2
HOST_STATE_ACKNOWLEDGED                  4
HOST_STATE_UNACKNOWLEDGED                8
HOST_CHECKS_DISABLED                     16
HOST_CHECKS_ENABLED                      32
HOST_EVENT_HANDLER_DISABLED              64
HOST_EVENT_HANDLER_ENABLED               128
HOST_FLAP_DETECTION_DISABLED             256
HOST_FLAP_DETECTION_ENABLED              512
HOST_IS_FLAPPING                         1024
HOST_IS_NOT_FLAPPING                     2048
HOST_NOTIFICATIONS_DISABLED              4096
HOST_NOTIFICATIONS_ENABLED               8192
HOST_PASSIVE_CHECKS_DISABLED             16384
HOST_PASSIVE_CHECKS_ENABLED              32768
HOST_PASSIVE_CHECK                       65536
HOST_ACTIVE_CHECK                        131072
HOST_HARD_STATE                          262144
HOST_SOFT_STATE                          524288
HOST_ACTIVE_CHECKS_DISABLED              1048576
HOST_ACTIVE_CHECKS_ENABLED               2097152

serviceprops:
SERVICE_SCHEDULED_DOWNTIME               1
SERVICE_NO_SCHEDULED_DOWNTIME            2
SERVICE_STATE_ACKNOWLEDGED               4
SERVICE_STATE_UNACKNOWLEDGED             8
SERVICE_CHECKS_DISABLED                  16
SERVICE_CHECKS_ENABLED                   32
SERVICE_EVENT_HANDLER_DISABLED           64
SERVICE_EVENT_HANDLER_ENABLED            128
SERVICE_FLAP_DETECTION_ENABLED           256
SERVICE_FLAP_DETECTION_DISABLED          512
SERVICE_IS_FLAPPING                      1024
SERVICE_IS_NOT_FLAPPING                  2048
SERVICE_NOTIFICATIONS_DISABLED           4096
SERVICE_NOTIFICATIONS_ENABLED            8192
SERVICE_PASSIVE_CHECKS_DISABLED          16384
SERVICE_PASSIVE_CHECKS_ENABLED           32768
SERVICE_PASSIVE_CHECK                    65536
SERVICE_ACTIVE_CHECK                     131072
SERVICE_HARD_STATE                       262144
SERVICE_SOFT_STATE                       524288
SERVICE_ACTIVE_CHECKS_DISABLED           1048576
SERVICE_ACTIVE_CHECKS_ENABLED            2097152

servicestatustypes:
SERVICE_PENDING                          1
SERVICE_OK                               2
SERVICE_WARNING                          4
SERVICE_UNKNOWN                          8
SERVICE_CRITICAL                         16
I created this in 2011 when I had to watch my sites 0-24h on a single monitor :). Later I started using this at the company I am working for. We are using it with 7 nagios instances and like 3k+ physical nodes and ~61k service.

