This is partially based on the nginx json content pack.
It is designed for people using nginx in a docker container, and will only work with nginx version 1.11.8 onwards (you can remove the escape=json from the nginx setup if you want to use an earlier version).
The advantage of using docker's GELF driver is that you get a LOT of extra information you'll otherwise (e.g. syslog) won't get. List of additional metadata fields you're getting when using docker's GELF driver (source):
- Hostname – Name of the Docker host
- Container ID – Full ID of the container
- Container Name – Human readable name of the container
- Image ID – ID of the image used to create this container
- Image Name – Human readable image name
- Command – Command or entrypoint that is executed inside of the container
- Tag – A tag that was given on creation time to identify containers easily
- Creation time – A timestamp when this container was started
- Log level – Was the message send to STDOUT or STDERR?
The core advantage of using json is that you can add arbitrary fields to the nginx logging and they will just appear magically in graylog rather than having to delve into complex regex expressions to do things.
This content pack will create one UDP input for both of nginx's logs (error_log and access_log).
Extractors are applied to effectively read the most important data into message fields. You will be able to do searches for all requests of a given remote IP, all requests that were answered with a HTTP 400 or just all requests that were slow.
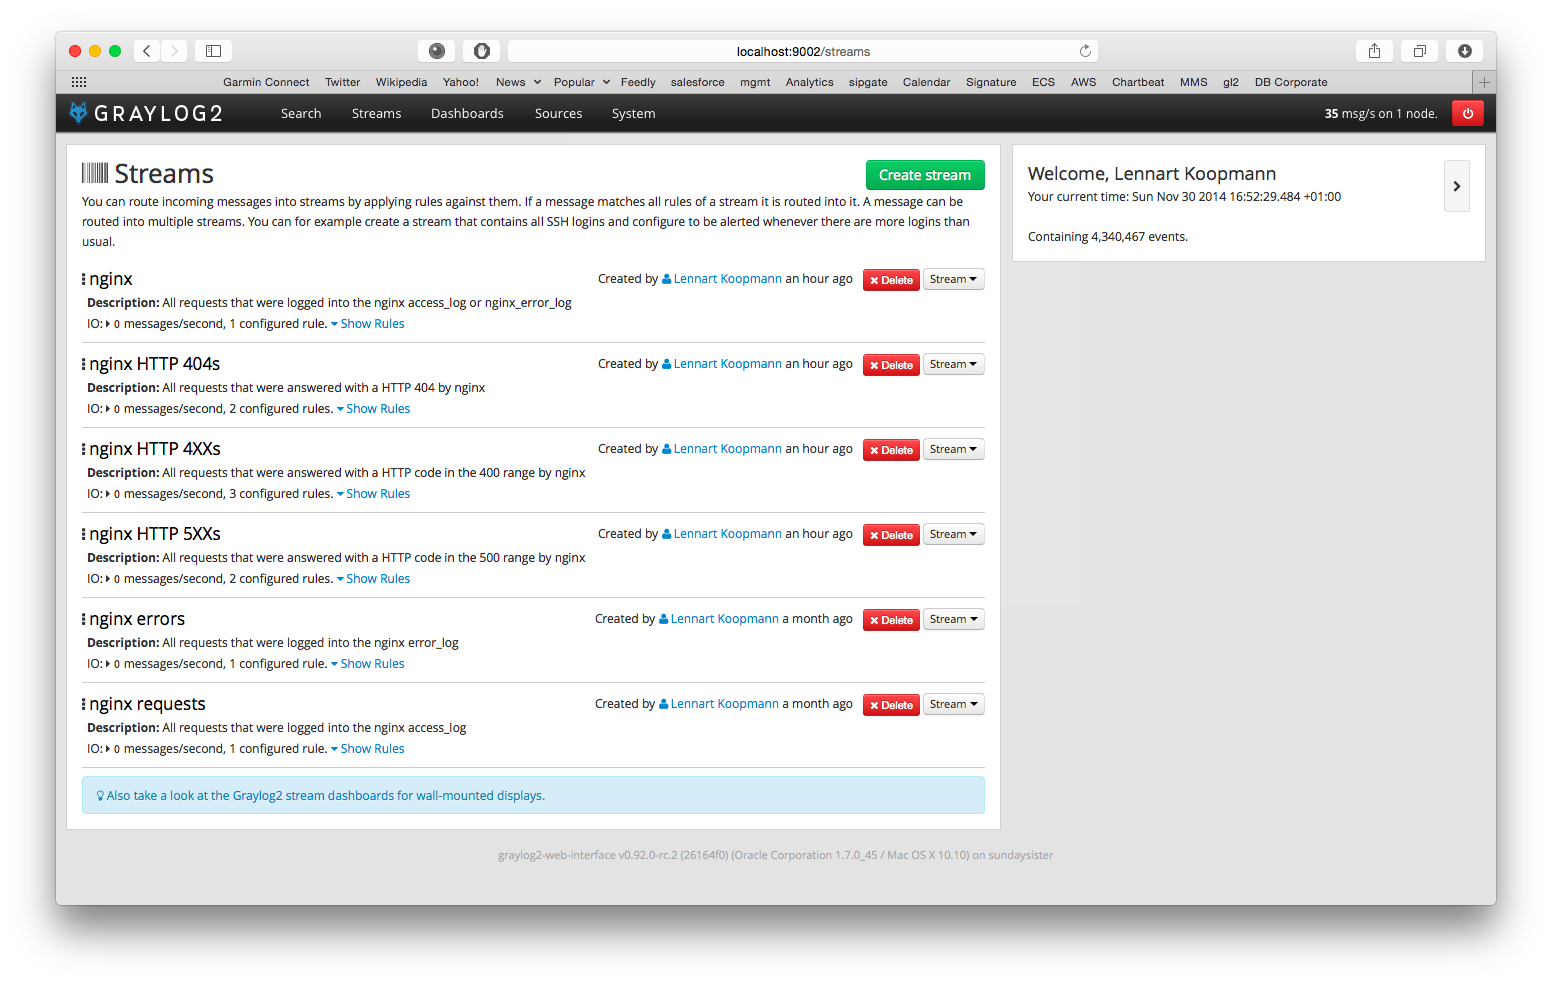
The pack comes with a default dashboard to build upon and several streams that pre-group your HTTP requests into interesting categories. The additional log information described below (see Configuring nginx) will also add timing information to the requests handled by nginx.
See screenshots at the bottom of this page.
You need to run at least nginx version 1.11.8, escaped JSON support.
Add this to your nginx configuration and restart the service:
log_format graylog2_json escape=json '{ "timestamp": "$time_iso8601", '
             '"remote_addr": "$remote_addr", '
             '"body_bytes_sent": $body_bytes_sent, '
             '"request_time": $request_time, '
             '"response_status": $status, '
             '"request": "$request", '
             '"request_method": "$request_method", '
             '"host": "$host",'
             '"upstream_cache_status": "$upstream_cache_status",'
             '"upstream_addr": "$upstream_addr",'
             '"http_x_forwarded_for": "$http_x_forwarded_for",'
             '"http_referrer": "$http_referer", '
             '"http_user_agent": "$http_user_agent", '
             '"http_version": "$server_protocol", '
             '"nginx_access": true }';

access_log /var/log/nginx/access.log graylog2_json;
error_log /var/log/nginx/error.log warn;
This configuration will send various NGINX variables to Graylog. You can log other useful information for each request by adding any other NGINX variables into the JSON.
Build
I recommend softlinking your log files to stdout/stderr, as done in nginx's Dockerfile, by adding this directive to your Dockerfile:
# forward request and error logs to docker log collector
RUN ln -sf /dev/stdout /var/log/nginx/access.log && ln -sf /dev/stderr /var/log/nginx/error.log
If you don't want to do that, you can simple change the two settings (access_log and error_log) to:
access_log /dev/stdout graylog2_json;
error_log stderr warn;
Run
Now, when your logs are collected by docker from stdout & stderr, you can run your docker using this command:
docker run --log-driver=gelf --log-opt gelf-address=udp://<GraylogIP>:12401 <ImageName> <Command>
for example:
docker run --log-driver=gelf --log-opt gelf-address=udp://<GraylogIP>:12401 busybox echo Hello Graylog

