Create beautiful, responsive charts and graphs directly inside ChatGPT. GraphGPT is the easiest way to visualize data in ChatGPT. Generate line charts, bar graphs, pie charts, and area charts from your conversations without leaving the chat interface.
Try GraphGPT Now → | Installation Guide →
- Visualize Data Instantly: Generate charts from pasted tables, CSV files, or natural language descriptions—perfect for ChatGPT data visualization.
- Multiple Chart Types: Supports line charts, bar graphs, pie charts, and area charts for comprehensive data analysis.
- Simple Install: Connect to the MCP server in seconds with no authentication required—works with any ChatGPT account.
- Interactive & Responsive: Charts are rendered with Recharts in a secure iframe and adapt to desktop, tablet, and mobile screens.
- Customizable: Tweak the title, colors, dimensions, axes labels, and data keys to match your brand or analysis needs.
GraphGPT can visualize data from your prompts. Simply describe what you want to chart in ChatGPT:
- "Plot monthly revenue from this table."
- "Show revenue vs expenses as a multi-line chart."
- "Create a pie chart of category shares."
- "Visualize sales data as a bar graph."
- "Turn this CSV into a line chart showing trends over time."
Learn more: Browse example use cases →
Get GraphGPT set up in under 2 minutes:
- In ChatGPT, navigate to Settings → Apps & Connectors.
- Click Create → Advanced settings.
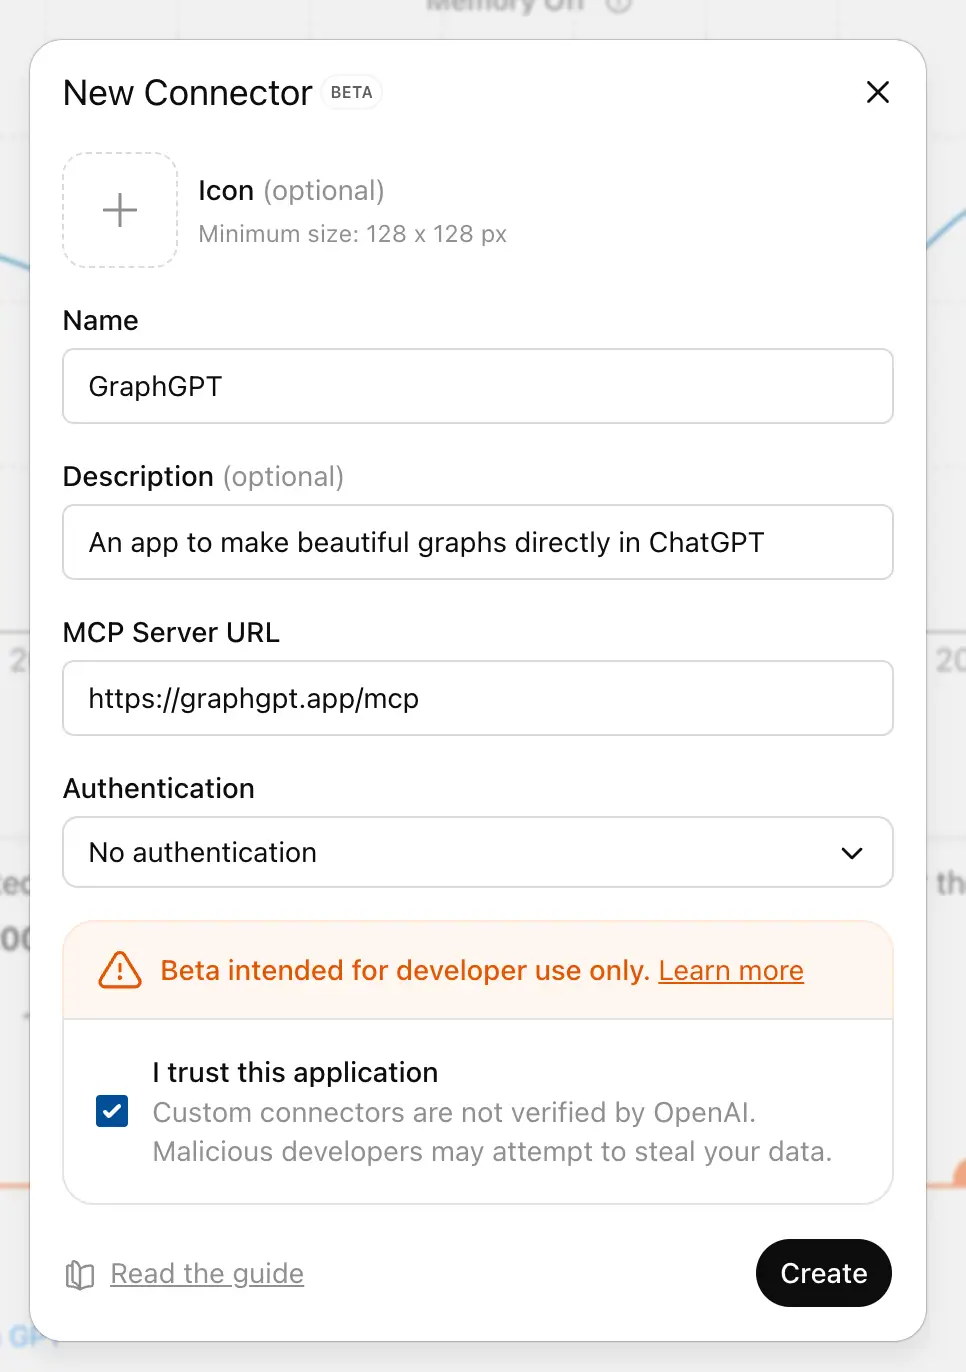
- Create a new developer connector with these details:
- Name:
GraphGPT - MCP Server URL:
https://graphgpt.app/mcp - Authentication:
No authentication
- Name:
Once connected, select GraphGPT from the + menu in the message composer and ask it to create a chart.
Example Prompt:
"Create a line chart of monthly revenue: Jan 10, Feb 14, Mar 18. Set xKey to 'month' and yKey to 'value'."
📖 Full installation guide: Step-by-step tutorial with screenshots →
GraphGPT is a ChatGPT app that enables you to create charts and graphs directly inside your ChatGPT conversations. Simply describe your data, and GraphGPT generates beautiful visualizations.
GraphGPT supports four chart types: line charts, bar graphs, pie charts, and area charts. Each chart type is fully customizable with custom colors, titles, and data keys.
Navigate to Settings → Apps & Connectors → Create → Advanced settings, then add GraphGPT using the MCP URL https://graphgpt.app/mcp. No authentication required.
Yes! GraphGPT can generate charts from pasted tables, CSV data, or natural language descriptions. Just paste your data into ChatGPT and ask GraphGPT to visualize it.
Yes, GraphGPT is completely free. Simply install the MCP connector and start creating charts in ChatGPT.
Yes, all charts are responsive and adapt to mobile, tablet, and desktop screens. GraphGPT works seamlessly across all devices.
More questions? Visit our FAQ page →
This repository contains a Next.js application that provides the charting widget and the MCP server.
- MCP Server (
app/mcp/route.ts): Exposes arender_charttool that accepts chart parameters. - Chart Widget (
app/chart/page.tsx): A client page that renders a Recharts chart fromwindow.openai.toolOutput. - Host Integration (
app/layout.tsx): Includes bootstrap scripts to ensure correct asset loading and navigation inside the ChatGPT iframe. - CORS Middleware (
middleware.ts): Handles cross-origin requests required for client-side navigation.
The render_chart tool returns structuredContent with fields like chartType, data, xKey, yKey, and other options, which the widget page consumes to render the visualization.
{
  "chartType": "line",
  "title": "Monthly Revenue",
  "xKey": "month",
  "yKey": "revenue",
  "height": 360,
  "colors": ["#4f46e5"],
  "data": [
    { "month": "Jan", "revenue": 10 },
    { "month": "Feb", "revenue": 14 },
    { "month": "Mar", "revenue": 18 }
  ]
}- Clone the repository.
- Install dependencies:
npm install
- Run the development server:
npm run dev
The application will be available at http://localhost:3000, and the MCP server will be at http://localhost:3000/mcp.
This project is optimized for deployment on Vercel. The production deployment at graphgpt.app demonstrates the full ChatGPT chart visualization capabilities.
The repository includes:
baseUrl.tsandnext.config.tsfor correct asset origins in iframes.middleware.tsfor handling CORS on client-side RSC fetches.app/sitemap.tsandpublic/robots.txtconfigured for SEO.
After deploying, connect ChatGPT to your production MCP URL: https://your-app.vercel.app/mcp. Live example: GraphGPT Production →
app/
  chart/              # Client page that renders Recharts from tool output
  mcp/                # MCP server exposing tools and resources
  layout.tsx          # Root layout with metadata & iframe bootstrap
  page.tsx            # Landing page with install steps and FAQs
middleware.ts         # CORS handling for RSC
next.config.ts        # Asset prefixing for iframe compatibility
GraphGPT is the simplest way to create charts in ChatGPT. Unlike external chart tools that require you to leave your conversation, GraphGPT renders visualizations directly inside ChatGPT's interface using the Model Context Protocol (MCP).
Perfect for:
- 📊 Data analysts who want quick visualizations during ChatGPT conversations
- 💼 Business professionals creating charts from reports and tables
- 🎓 Students visualizing data for projects and presentations
- 🧪 Researchers turning data into insights without switching tools