LAUNCH APP: https://share.streamlit.io/lariannrupp/machine_learning_algorithmic_trading_bot/main/streamlit.py
The purpose of the Project is to create a streamlit dashboard; which given a specific stock, performs a comparative analysis of machine-learning model design in a testing environment. It is called the "Technical Indicator Analysis with ML".
The dashboard demonstrates the framework for a more powerful terminal that can take a stock and design a machine learning model for it.
The app is deployed to a Streamlit interface, so to use the app, no installation is required. Simply launch the link at the top of the README.
To run it from local computer, clone repo. From the Terminal, activate conda envirnoment; change directory to repo folder,
and type streamlit run streamlit.py. This will launch a web browser with a local URL such as http://localhost:8501. Note that you will need to install some libraries/dependencies if you do not already have them. You can do so by typing pip install requirements.txt into the terminal.
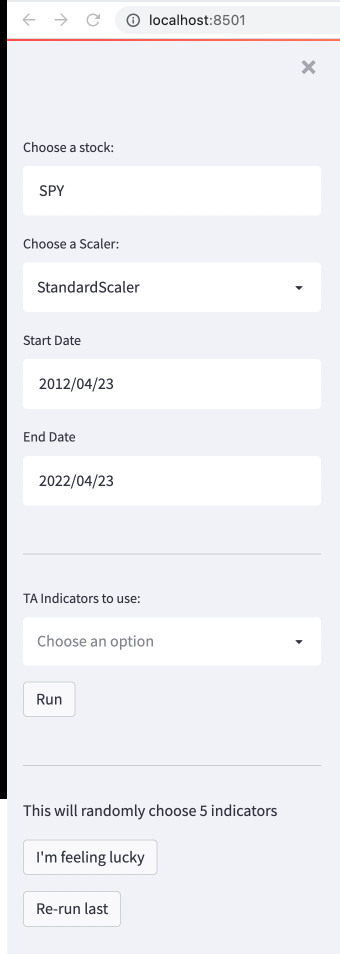
OHLVC (open, high, low, volume, close) stock data is pulled from the Yahoo Finance API. You can choose a start date and an end date to analyze.
The data undergoes a standard train, fit, predit process with the training window being 60% of the data, and the testing window being 40% of the data.
By default, the app scales X features with StandardScaler(), but within the app, the user can test out different data scaling methods.
The following machine learning models were selected because they are common, supervised models with binary classification systems:
-
SVM (Support Vector Machine)
-
Random Forest
-
Naive Bayes
-
AdaBoost
The User can test combinations of up to 54 technical indicators. However, testing all 54 indicators at once would take a long time and a personal computer may not have the power for this request. We recommend using 5 indicators, which results in 31 possible combinations (i.e., each indicator by itself, all 5 indicators together, and all combinations of 2, 3, and 4 indicators). Then, the top 10 best-performing combinations are displayed.
For users who would like to explore combinations of a random 5 indicators, they can use the I'm feeling lucky button.
The Re-run last button allows the user to select a different scaler, for example, and make comparisons by testing the same indicators from the last run.
Dashboard: Select parameters to perform Technical Indicator Analysis with ML.
Results appear as follows:
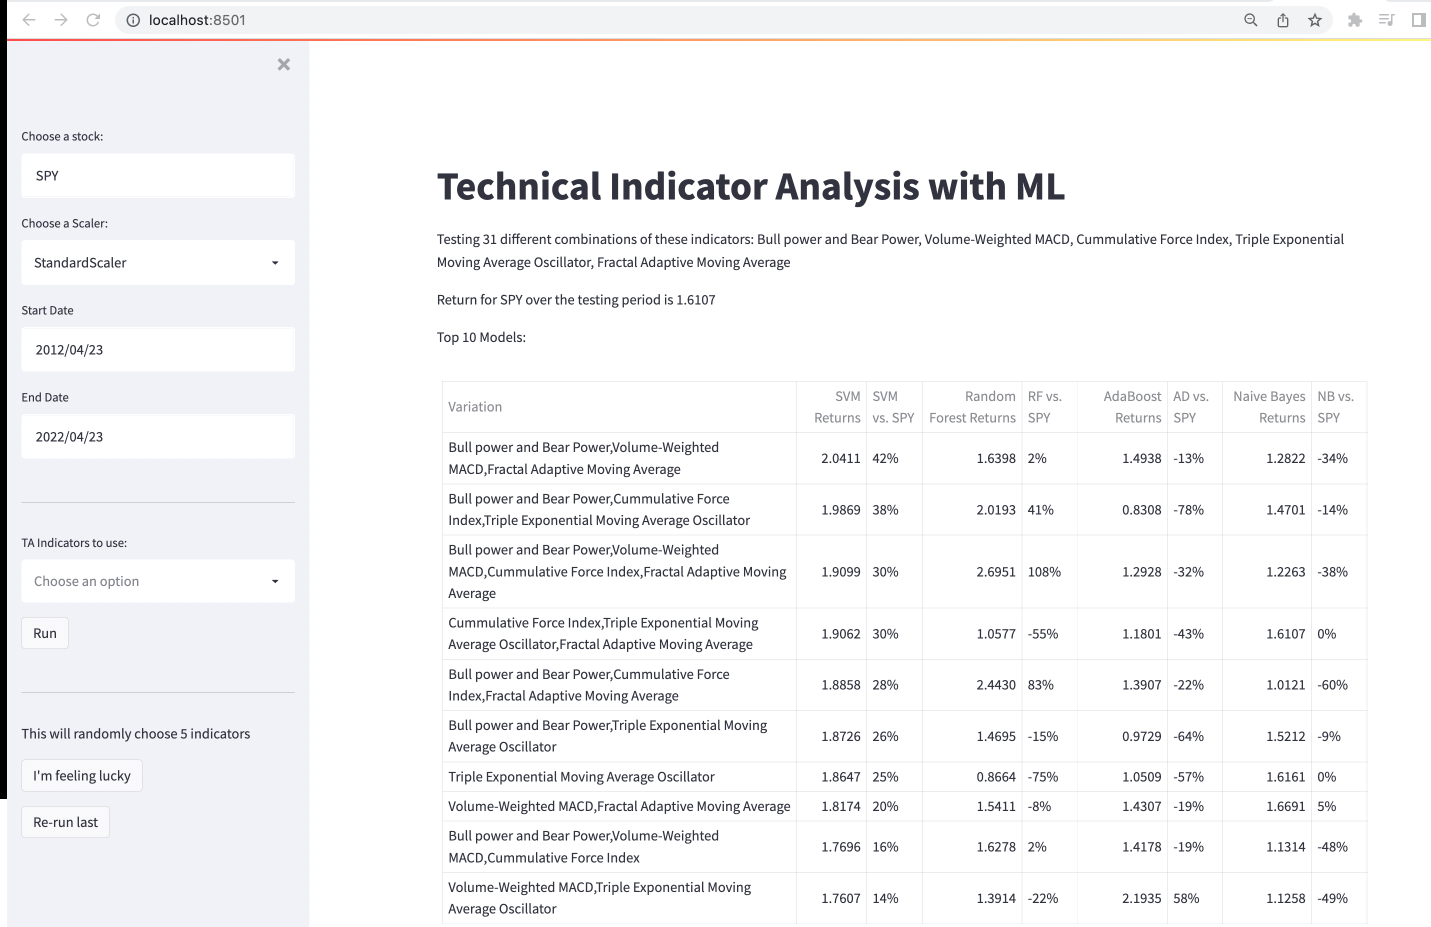
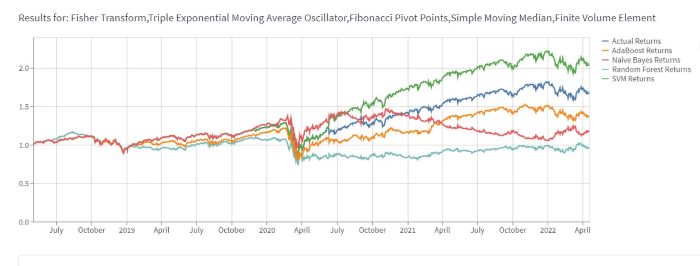
Cumulative return plots compare model performance to market performance. Additionally, the table for "Top 10 Models" compares cumulative returns as both a ratio and a percentage.
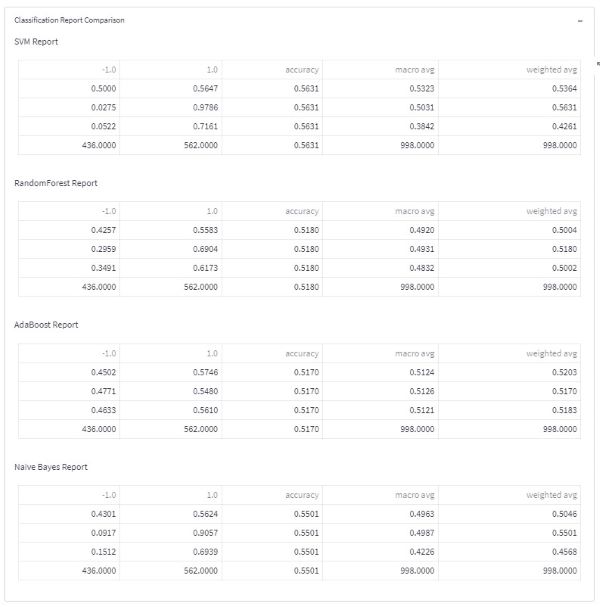
To backtest the models and compare trade accuracies, the user can drop down the Classification Report Comparison button. Please note that trade accuracies can oftentimes be a better metric of model performance than cumulative returns.
Leigh Badua
John Batarse
Catherine Croft
Jing Pu
Jason Rossi
Lari Rupp
University of California Berkelely Fintech Bootcamp (Project 2, 2022)
Trilogy Education LLC.
Kevin Lee (Instructor)
Vincent Lin (TA)
A Python 3.9.7 (ipykernal) was used to write this app.


Creative Commons Zero
This is a truly open-source project under the Creative Commons Zero license which is free for use for everyone.
We ask that you please credit the team with the following IEEE citation:
L. Badua, J. Batarse, C. Croft, J. Pu, J. Rossi, L. Rupp, “Machine_Learning_Algorithmic_Trading_Bot,” University of California Berkeley Extension Fintech Bootcamp, Berkeley, California, USA, Fintech Bootcamp Project 2, 2022. https://github.com/lariannrupp/Machine_Learning_Algorithmic_Trading_Bot (accessed month day, year).