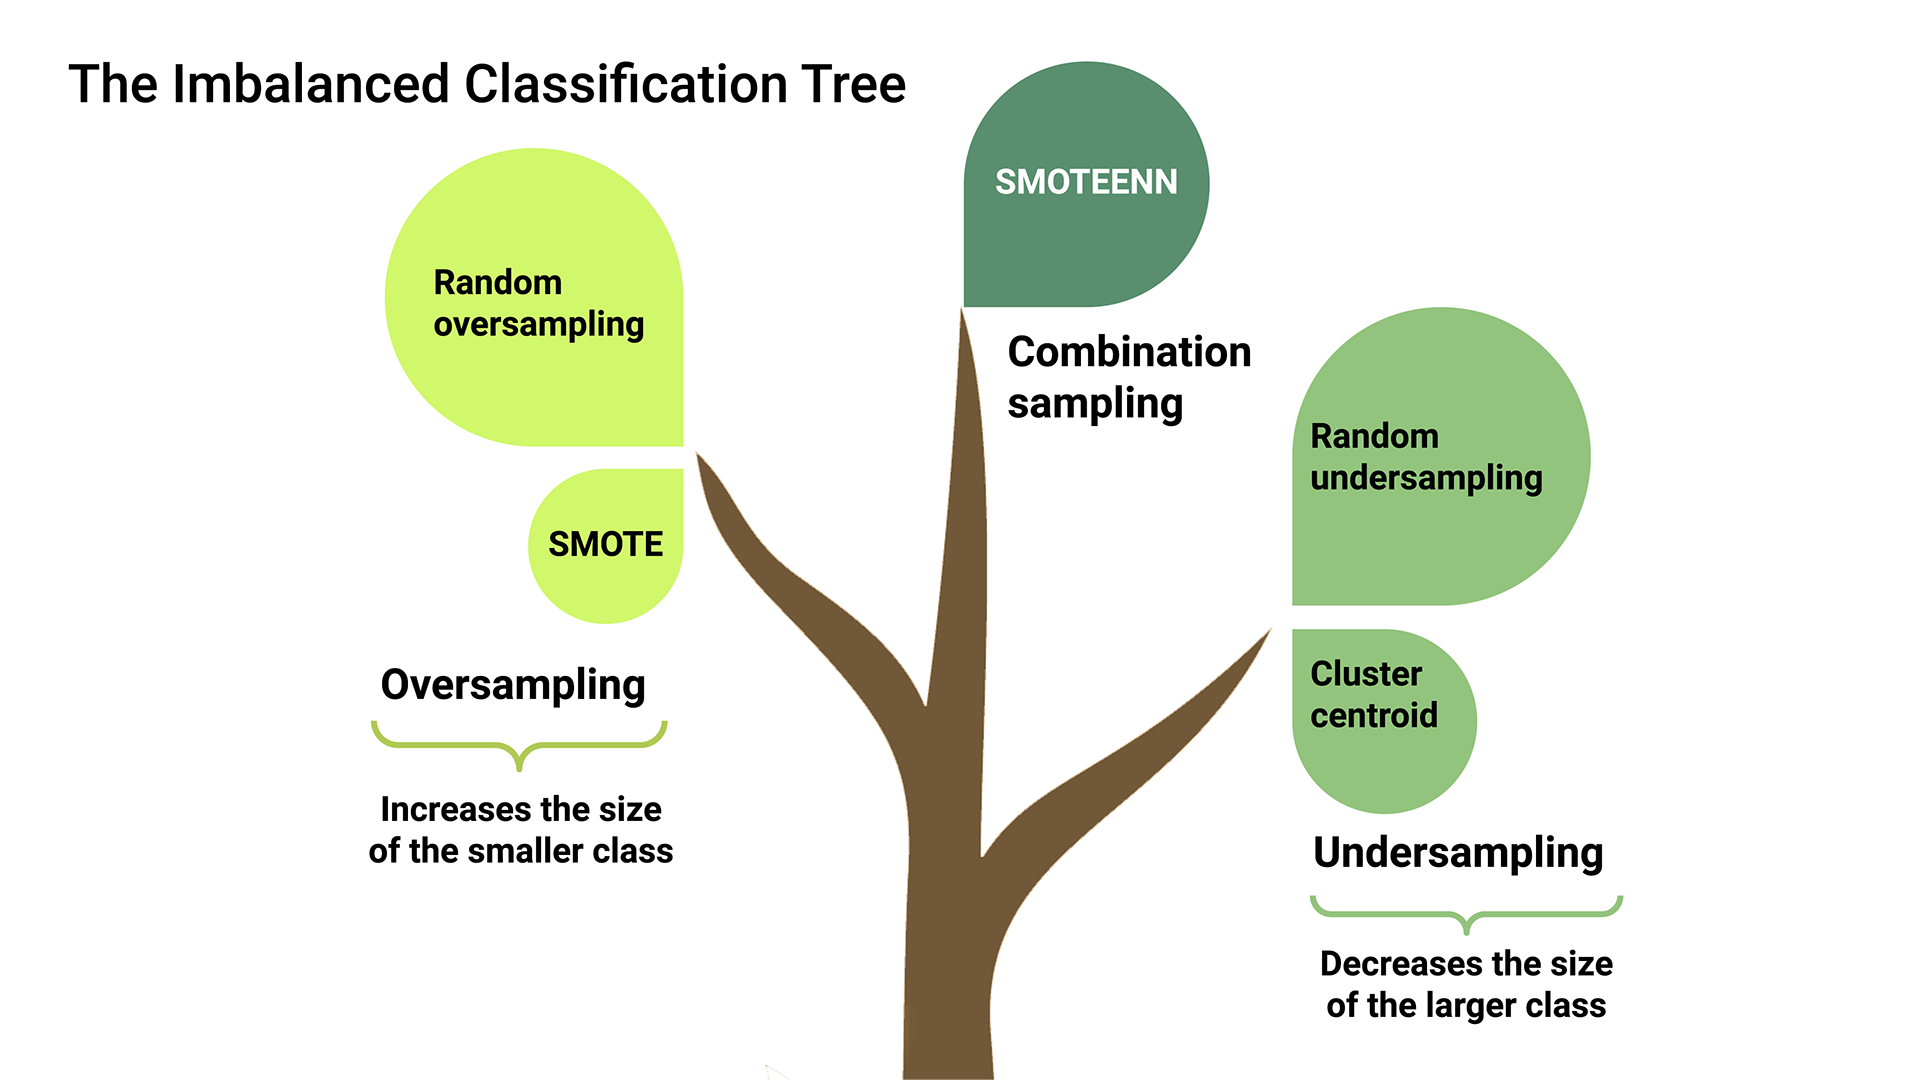
Credit risk poses a classification problem that’s inherently imbalanced. This is because healthy loans easily outnumber risky loans.
The purpose of this exercise is to use various techniques to train and evaluate models with imbalanced classes.
I use a dataset of historical lending activity from a peer-to-peer lending services company to build a model that can identify the creditworthiness of borrowers and predict them to be "healthy loans" or "high-risk loans"
To do this exercise, I'll use the following stages of the machine learning process:
-
Read the data
-
Visualize the data
-
Split the data into training and testing sets
-
Oversample the data
-
Fit a logistic regression model
-
Make predictions
-
Evaluate the model
This model is ran twice: once with a traditional sampling method and once with an oversampling method. Based on the information in the classification report, we can see which method produces more accurate results.
Using bulleted lists, describe the balanced accuracy scores and the precision and recall scores of all machine learning models.
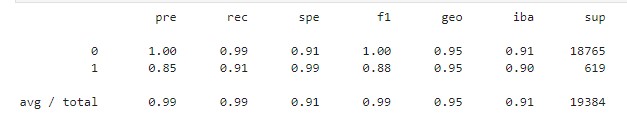
- Machine Learning Model 1 with traditional sampling:
- For healthy loans (0), the model predicts 1.00 for precision and 0.99 for recall. For high-risk loans, the model predicts 0.85 for precision and 0.91 for recall, which means that the model will sometimes misclassify high-risk loans.
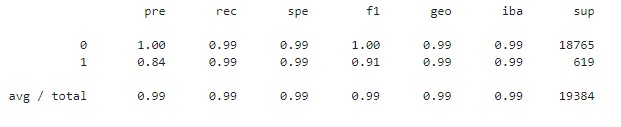
- Machine Learning Model 2 with an oversampling method:
- The model appears to be fairly accurate for high-risk (1) loans with a balanced accuracy of 0.99, a precision of 0.84, and a recall of 0.91.
The regression model overall improves the prediction for high-risk loans (1). In terms of precision, the value was reduced slightly from 0.85 to 0.84. However,in terms of recall, the minority class metric using resampled data was much better (0.99 vs 0.91) Meaning that the resampled data is more accurately predicting high-risk loans. This is important because the purpose of resampling was to improve our prediction o the minority class, which is high-risk loans.