This blog is about how to publish and subscribe Temperature and Humidity to the a MQTT Broker in the cloud and how to subscribe to the data and insert into a SQL db. A simple python flask app is used to chart the data.
It is assumed that the user is aware of MQTT protocols, working with NodeMCU microcontrollers, Database operations like Insert, retrieve, setting up of web server, some basic understanding of Python programming languages etc.
Parts needed
NodeMCU
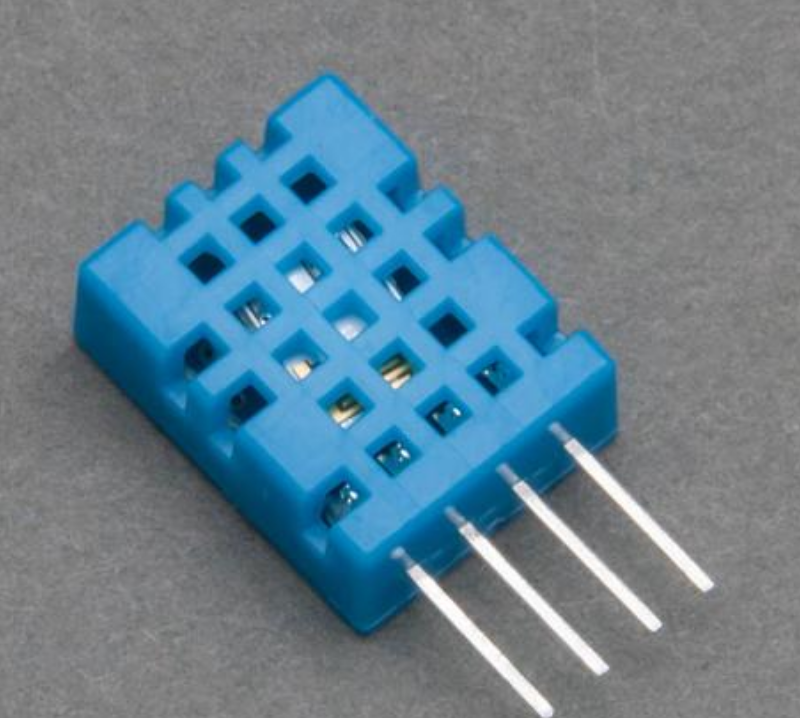
DHT11 Temperature sensor.
A WiFi Router to which the microcontroller will connect to publish the temperature.
Internet connection so that it can talk to the MQTT broker.
Some knowledge of C/C++, Python programming.
Basic understanding of MQTT Protocols.
Arduino IDE installed to compile and Upload code to NodeMCU.
NodeMCU Pin Diagram familiarity.
An Android Smartphone to subscribe and publish to events from cloud.
An account with cloudmqtt.com MQTT Broker.
Install Python, Flask, and a Web Server on your local server/laptop to render the graphics.
A Typical NodeMCU and Pin diagram:

DHT 11 temperature sensor that was used for this demo.
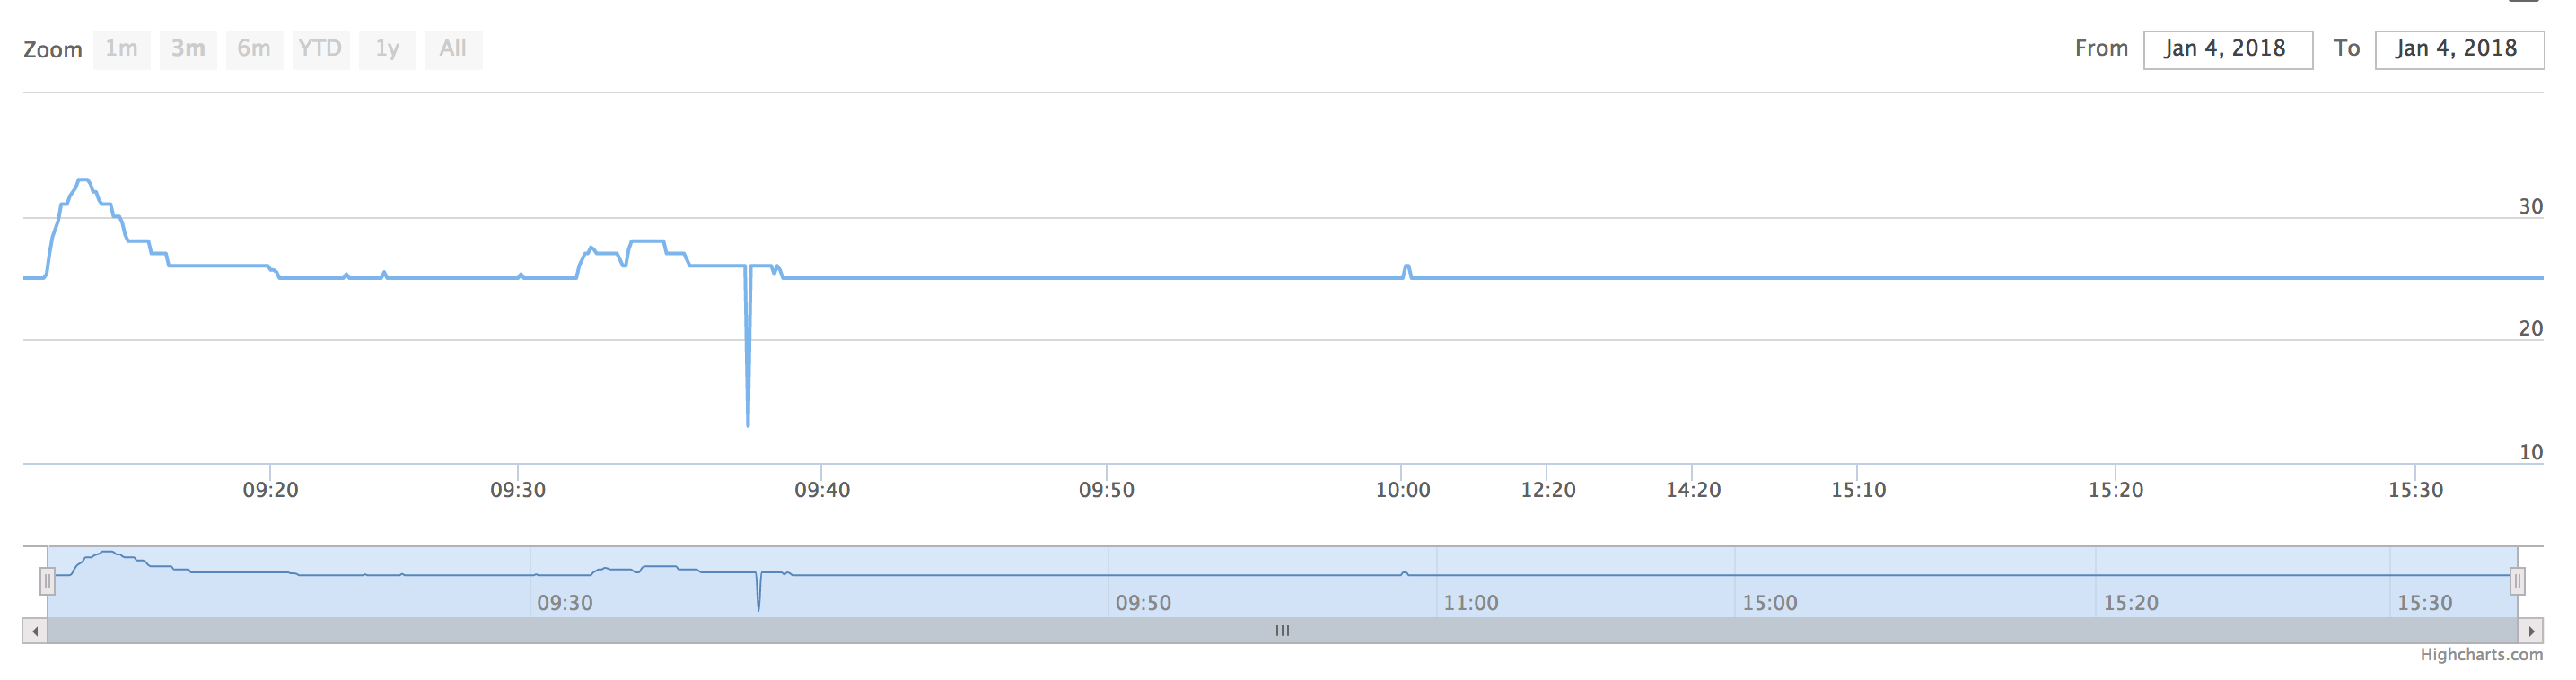
The Charting that was showing the temperature in the web portal.
Setup your instance in MQTT broker portal called CloudMQTT
- CloudMQTT.com
Create a free instance in CloudMQTT and for now - pick CuteCat option as this is sufficient for this demo. The temperature sensor connected to the NodeMCU will publish this data to the Cloud. This is a third party broker offering and easy to sign and use.
- Connections from Temperature Sensor DHT11 to NodeMCU.
Connect the Temperature Sensor's DHT11 signal pin to NodeMCU's Pin 16 (GPIO0), and Vcc and GND of the Temperature sensor to 3.3v and GND pins of the NodeMCU respectively.
Node MCU 	DHT11
=====================
16		Signal
Vcc 3.3v	Vcc
GND		GND
Load the code TempSensor.ino to Arduino IDE.
Update the ssid, password of the WiFI router in the code in your location.
Insert the userid and the password of the CloudMQTT' user instance in these line in the code.
client.connect("ESP8266Client", "UserId", "Password")) {
Upload the code to NodeMCU.
Open the Serial Monitor and check that the connections are set and working and read the Temperature and Humidity of the room.
Install a web server on your server or laptop.
Check that the home page works, before starting to port the code.
cd to the folder of the webserver $HOME location
Install Python, Flask, paho-mqtt library
pip install flask

pip install paho-mqtt
Download/git clone static.zip to the webserver $HOME location.
Create a templates folder, and copy the graph.html to it.
	<!DOCTYPE HTML>
	<html>
		<head>
			<meta http-equiv="Content-Type" content="text/html; charset=utf-8">
			<title>Highstock Example</title>
	        <script src="{{ url_for('static', filename='jquery-1.8.3.min.js') }}"></script>
			<script type="text/javascript">
			$(function () {
	    $.getJSON('http://0.0.0.0:5000/data.json', function (data) {
	        // Create the chart
	        $('#container').highcharts('StockChart', {
	            rangeSelector : {
	                selected : 1
	            },
	            title : {
	                text : 'My Sensor'
	            },
	            series : [{
	                name : 'Value',
	                data : data,
	                tooltip: {
	                    valueDecimals: 2
	                }
	            }]
	        });
	    });
	});
			</script>
		</head>
		<body>
	<script src="{{ url_for('static', filename='highstock.js') }}"></script>
	<script src="{{ url_for('static', filename='highcharts-more.js') }}"></script>
	<script src="{{ url_for('static', filename='exporting.js') }}"></script>
	<div id="container" style="min-width: 310px; height: 400px; margin: 0 auto"></div>

		</body>
	</html>
Unzip the static.zip and it will create a 'static' folder with required files in it.
Run the init_db_tables.py, this will create an empty IoT.db file in the current folder.
python init_db_tables.py
This creates a IoT.db database in the current folder.
After connecting the sensor to NodeMCU, and Uploading the TempSenso.ino, the data from the sensor should start publishing to the cloud.
If the credentials, MQTT Port, user name, and the password is correct, the data will be seen in the Arduino IDE serial monitor as well on the WebSocket UI console of the Cloudmqtt.com
python publish_dummy_data.py
This should send some random Temperature and Humidity to the remote mqtt broker, You should be able to see it on the Cloudmqtt.com websockets UI console.
cd to the folder where the web server $HOME is located and run this code which will subscribe to the topic and start getting data. The data is then inserted to the database.
python mqtt_listen_sensor_data.py
If everything is set, one would see messages like this in the terminal.
	MQTT Data Received...
	MQTT Topic: PublishTopic/Temperature
	Data: {"Date":  "Sun, 14 Jan 2018 16:59:57 GMT", "Sensor_ID": "Dummy-2", "Temperature":   "26" }
	About to Insert Temperature Data into Database.
	Data: [ SensorID: Dummy-2, Temperature:26, Data_and_Time: 1515949198]
	Inserted Temperature Data into Database.

	MQTT Data Received...
	MQTT Topic: PublishTopic/Temperature
	Data: {"Date":  "Sun, 14 Jan 2018 16:59:59 GMT", "Sensor_ID": "Dummy-2", "Temperature":   "26" }
	About to Insert Temperature Data into Database.
	Data: [ SensorID: Dummy-2, Temperature:26, Data_and_Time: 1515949200]
	Inserted Temperature Data into Database.
servepage.py
	from flask import Flask, render_template, request
	import sqlite3
	import json

	app = Flask(__name__)


	@app.route("/data.json")
	def data():
	    connection = sqlite3.connect("IoT.db")
	    cursor = connection.cursor()
	    cursor.execute("SELECT 1000*timestamp, Temperature from DHT22_Temperature_Data")
	    results = cursor.fetchall()
	    print results
	    return json.dumps(results)

	@app.route("/graph")
	def graph():
	    return render_template('graph.html')


	if __name__ == '__main__':
	    app.run(
	    debug=True,
	    threaded=True,
	    host='0.0.0.0'
	)
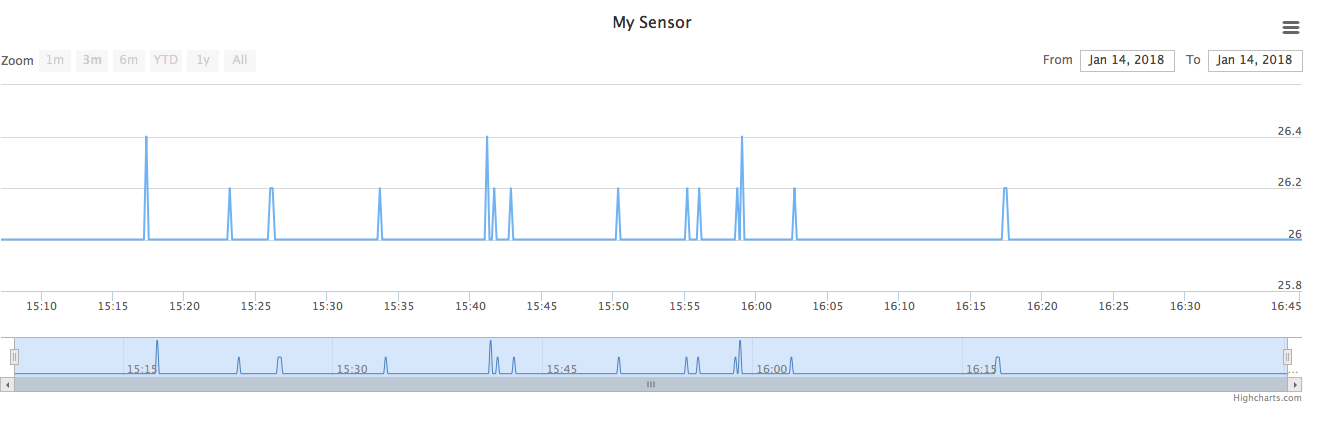
Another snapshot of readings from a real DHT-11 sensor connected to the NodeMCU
Check that you have entered the right "ssid", "password", and "mqtt server" details for client.connect( ) from Cloudmqtt.com in Arduino IDE temperature.ino code.
Restart the Cloudmqtt instance in case you are not seeing the data on the WebSocket UI console of Cloudmqtt.com
Check that the Temperature and Humidity data is showing up on the Serial Monitor of the Arduino IDE.
Open the WebSocket UI of cloudmqtt and see that you are getting the data from the NodeMCU.
Simulate publishing data to Cloudmqtt.com :
python publish_dummy_data.py
https://iotbytes.wordpress.com/store-mqtt-data-from-sensors-into-sql-database/
https://www.fontenay-ronan.fr/dynamic-charts-with-highcharts-sqlite-and-python/