This is Portfolio Project on Covid Data.
Source of Dataset is Our World in Data ,Link - https://ourworldindata.org/covid-deaths
SQL - Data Exploration
In this we explored the Covid Data by using SQL Queries and get the Different Visuals of it , Which we can use in Our Dashboard to show the data Visually.
Power BI Dashboard
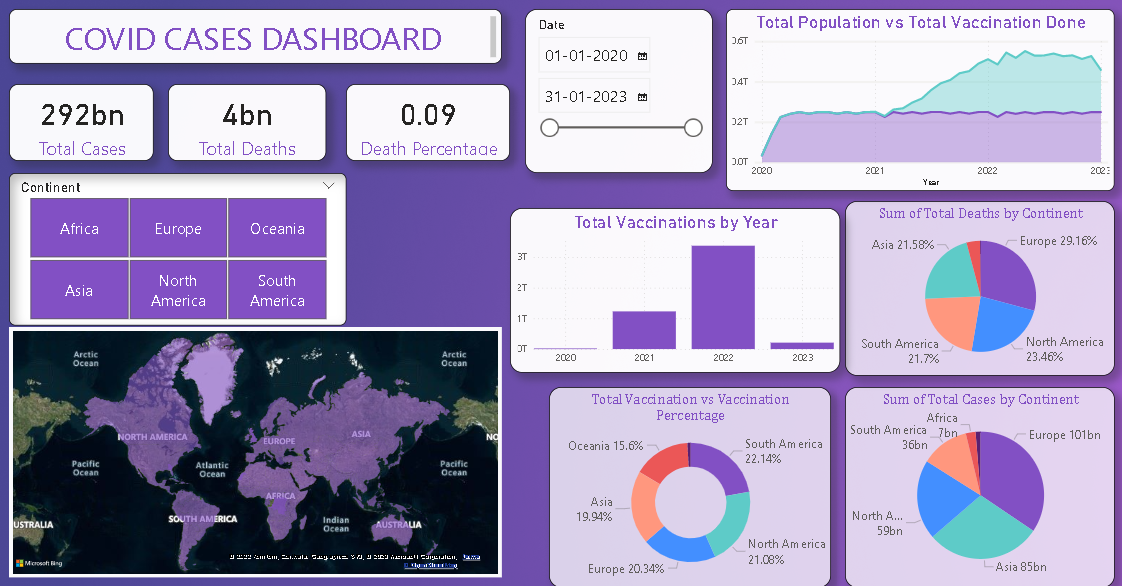
In this ETL Process is used - First the Extraction of data done which i got from Running Queries and then Tranformation Done by Converting NULL values to 0 and futhermore changing the Datatype of columns and then I loaded all the Tranformed Data in Power BI to generate a Interative Dashboard for Different Parameters.
Data Cleaning in SQL
In this i have taken a different data that is Nashville Housing Data for Cleaning
Correlation in Python
Source of Data is Kaggle , Link -> https://www.kaggle.com/datasets/danielgrijalvas/movies?resource= In this i have used movies data and different Libraries of Python like numpy,pandas,matplotlib,seaborn to find which categories have the higest correlation between them.