Tablesaw is Java for data science. It includes a dataframe and a visualization library, as well as utilities for loading, transforming, filtering, and summarizing data. It's fast and careful with memory. If you work with data in Java, it may save you time and effort. Tablesaw also supports descriptive statistics and integrates well with the Smile machine learning library.
- Import data from RDBMS and CSV files, local or remote (http, S3, etc.)
- Combine tables by appending or joining
- Add and remove columns or rows
- Sort, Group, Query
- Map/Reduce operations
- Handle missing values
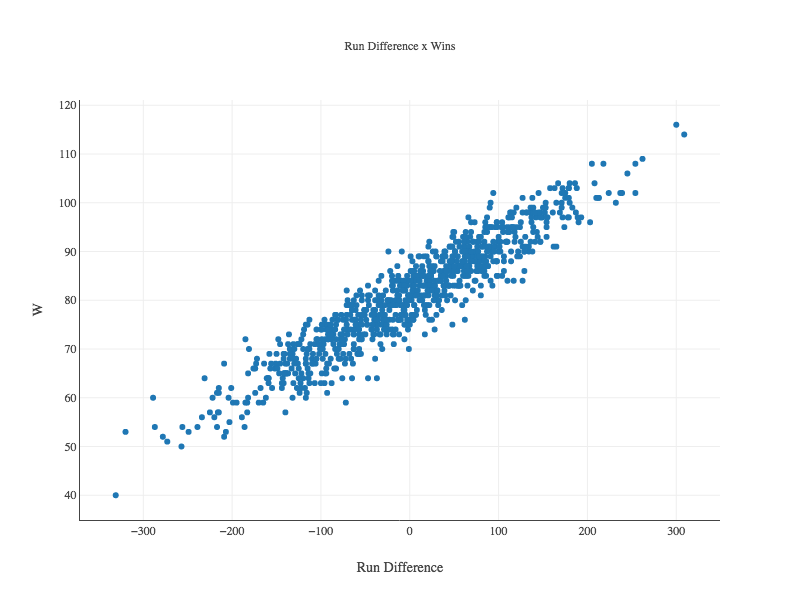
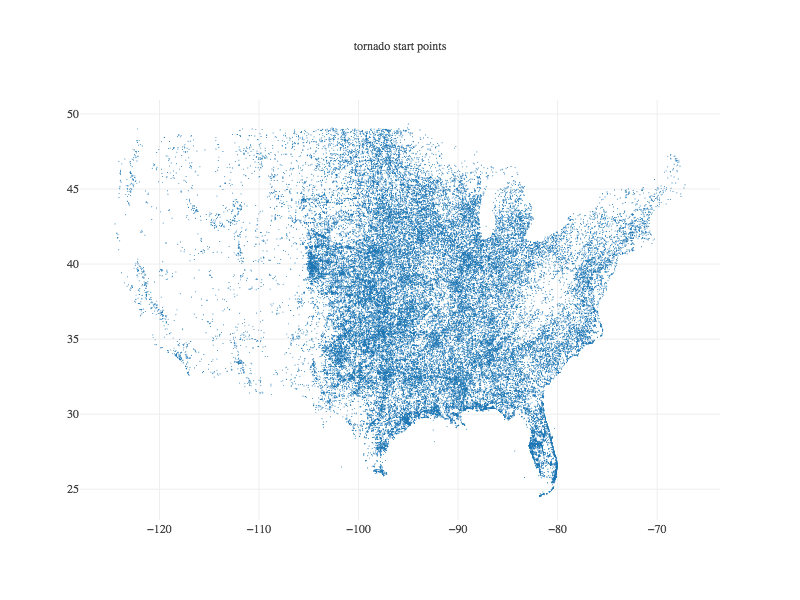
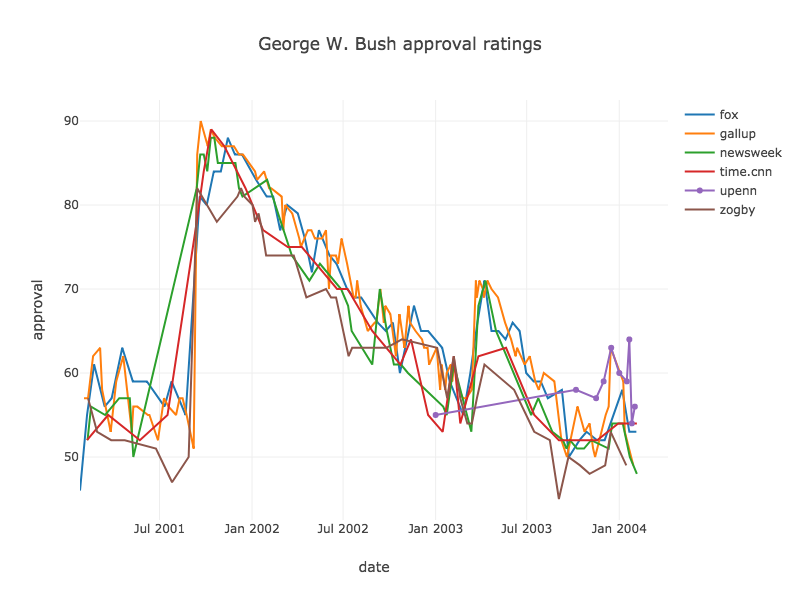
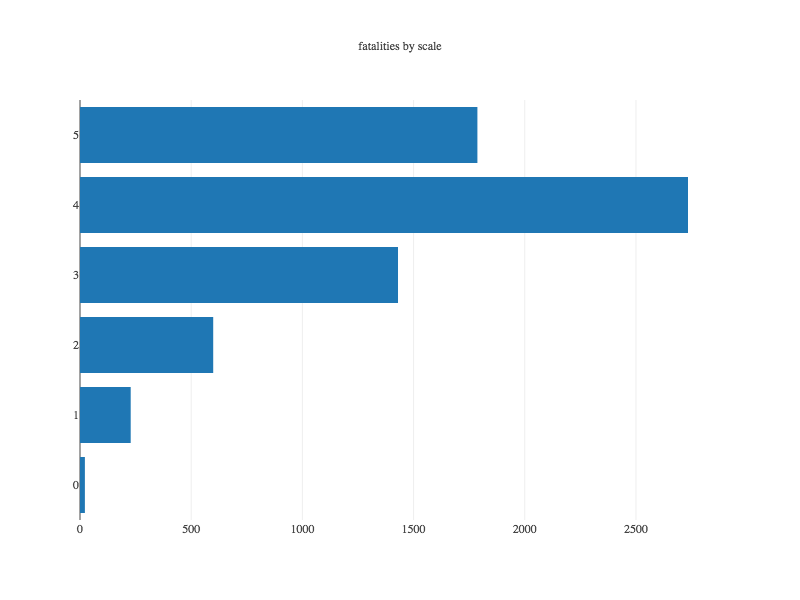
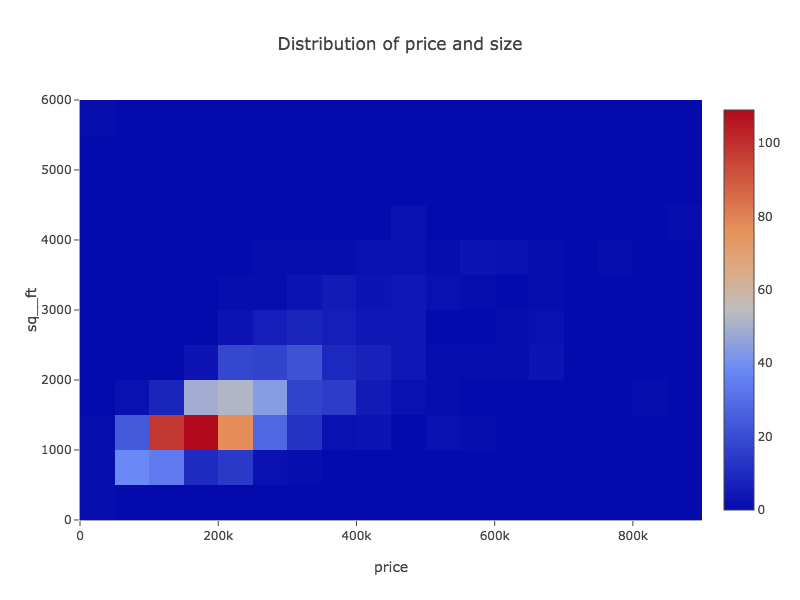
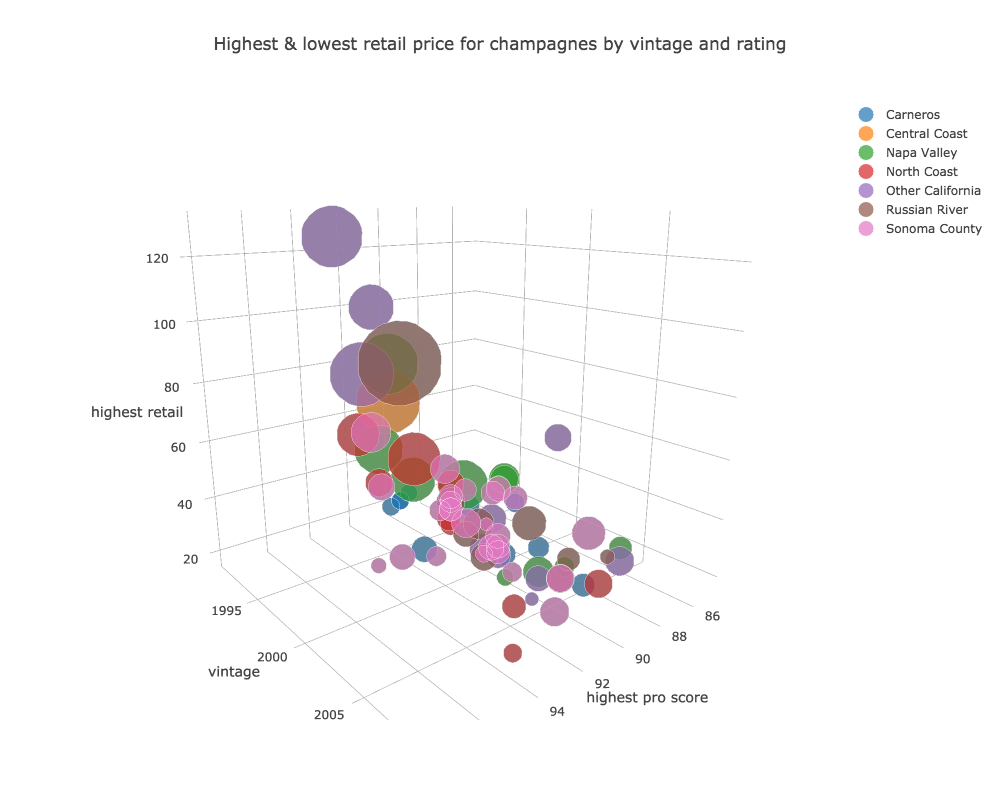
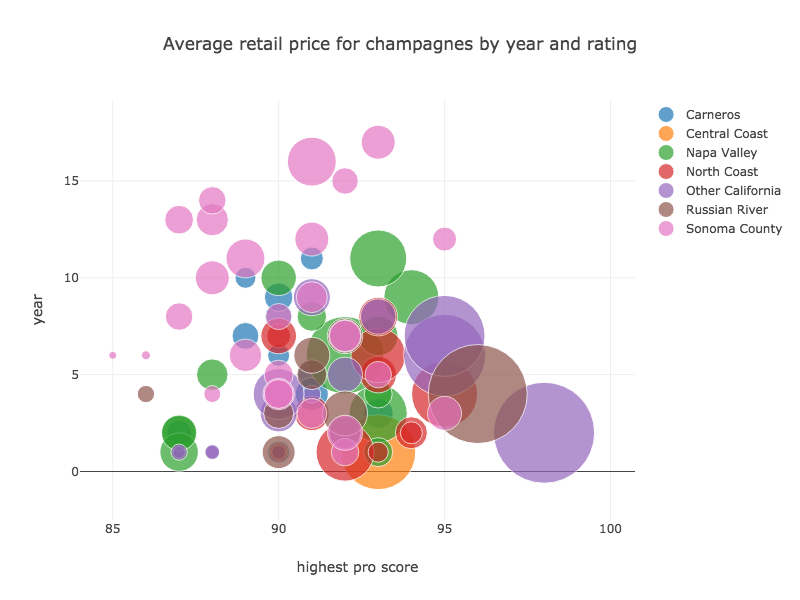
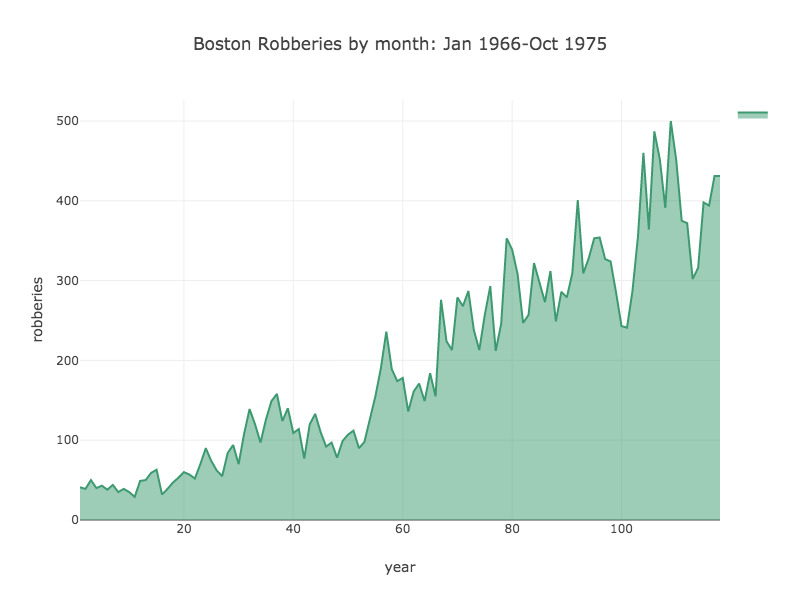
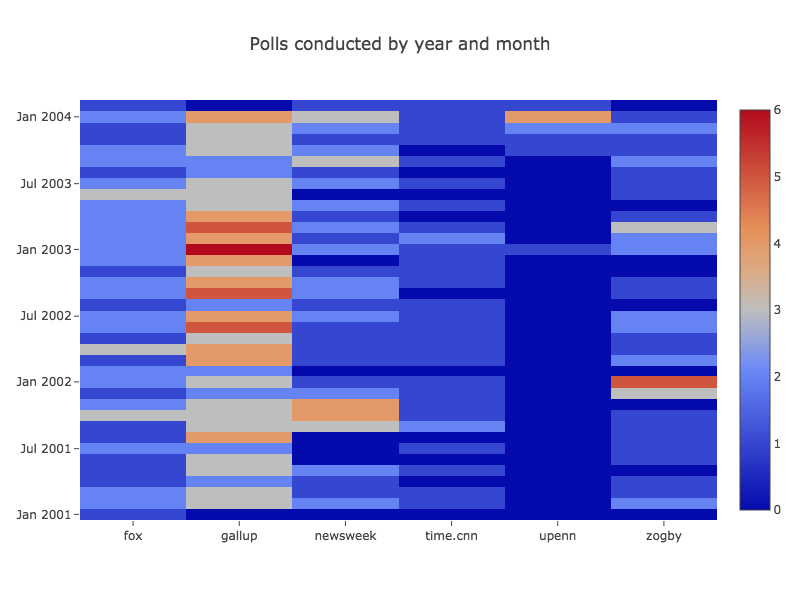
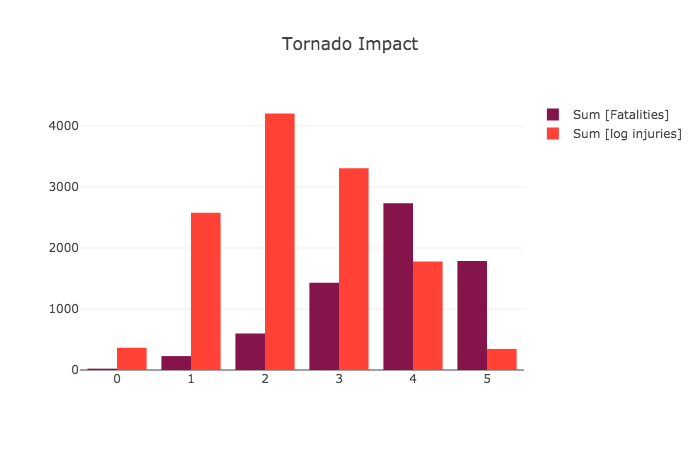
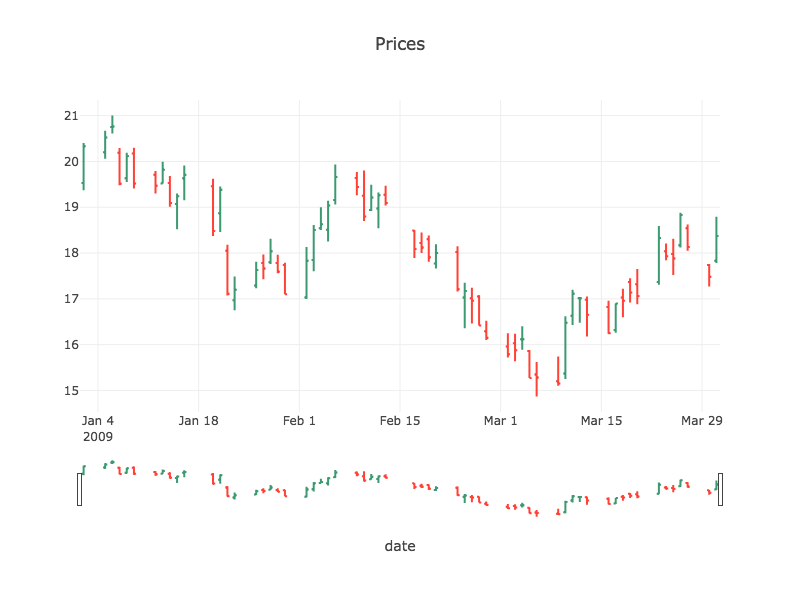
Tablesaw supports data visualization by providing a wrapper for the Plot.ly JavaScript plotting library. Here are a few examples of the new library in action.
 |
 |
 |
|---|---|---|
 |
 |
 |
 |
 |
 |
 |
 |
 |
 |
 |
 |
- Descriptive stats: mean, min, max, median, sum, product, standard deviation, variance, percentiles, geometric mean, skewness, kurtosis, etc.
Add tablesaw-core and tablesaw-jsplot to your project:
<dependency>
    <groupId>tech.tablesaw</groupId>
    <artifactId>tablesaw-core</artifactId>
    <version>0.30.1</version>
</dependency>
<dependency>
    <groupId>tech.tablesaw</groupId>
    <artifactId>tablesaw-jsplot</artifactId>
    <version>0.30.1</version>
</dependency>- Start here: https://jtablesaw.github.io/tablesaw/gettingstarted
- Then see our documentation page: https://jtablesaw.github.io/tablesaw/ and the Tablesaw User Guide.
And always feel free to ask questions or make suggestions here on the issues tab.
- We recommend trying Tablesaw inside Jupyter notebooks, which lets you experiment with Tablesaw in a more interactive manner. Get started by installing BeakerX and trying the sample Tablesaw notebook
- You may utilize Tablesaw with many machine learning libraries. To see an example of using Tablesaw with Smile check out the sample Tablesaw Jupyter notebook
- You may use quandl4j-tablesaw if you'd like to load financial and economic data from Quandl into Tablesaw. This is demonstrated in the sample Tablesaw notebook as well
