JMCLOZANO - Final project 5003 [charts] https://jmclozano.github.io/mychartFINALproject/
Visualize - data from the school’s use of technology tools in a district.
note this was version 2 of final project. I was working on resume and changed direction with the guidance of our Professor to find "what I like" and I like data =) https://jmclozano.github.io/mychartFINALproject/img/resume%20v100.png
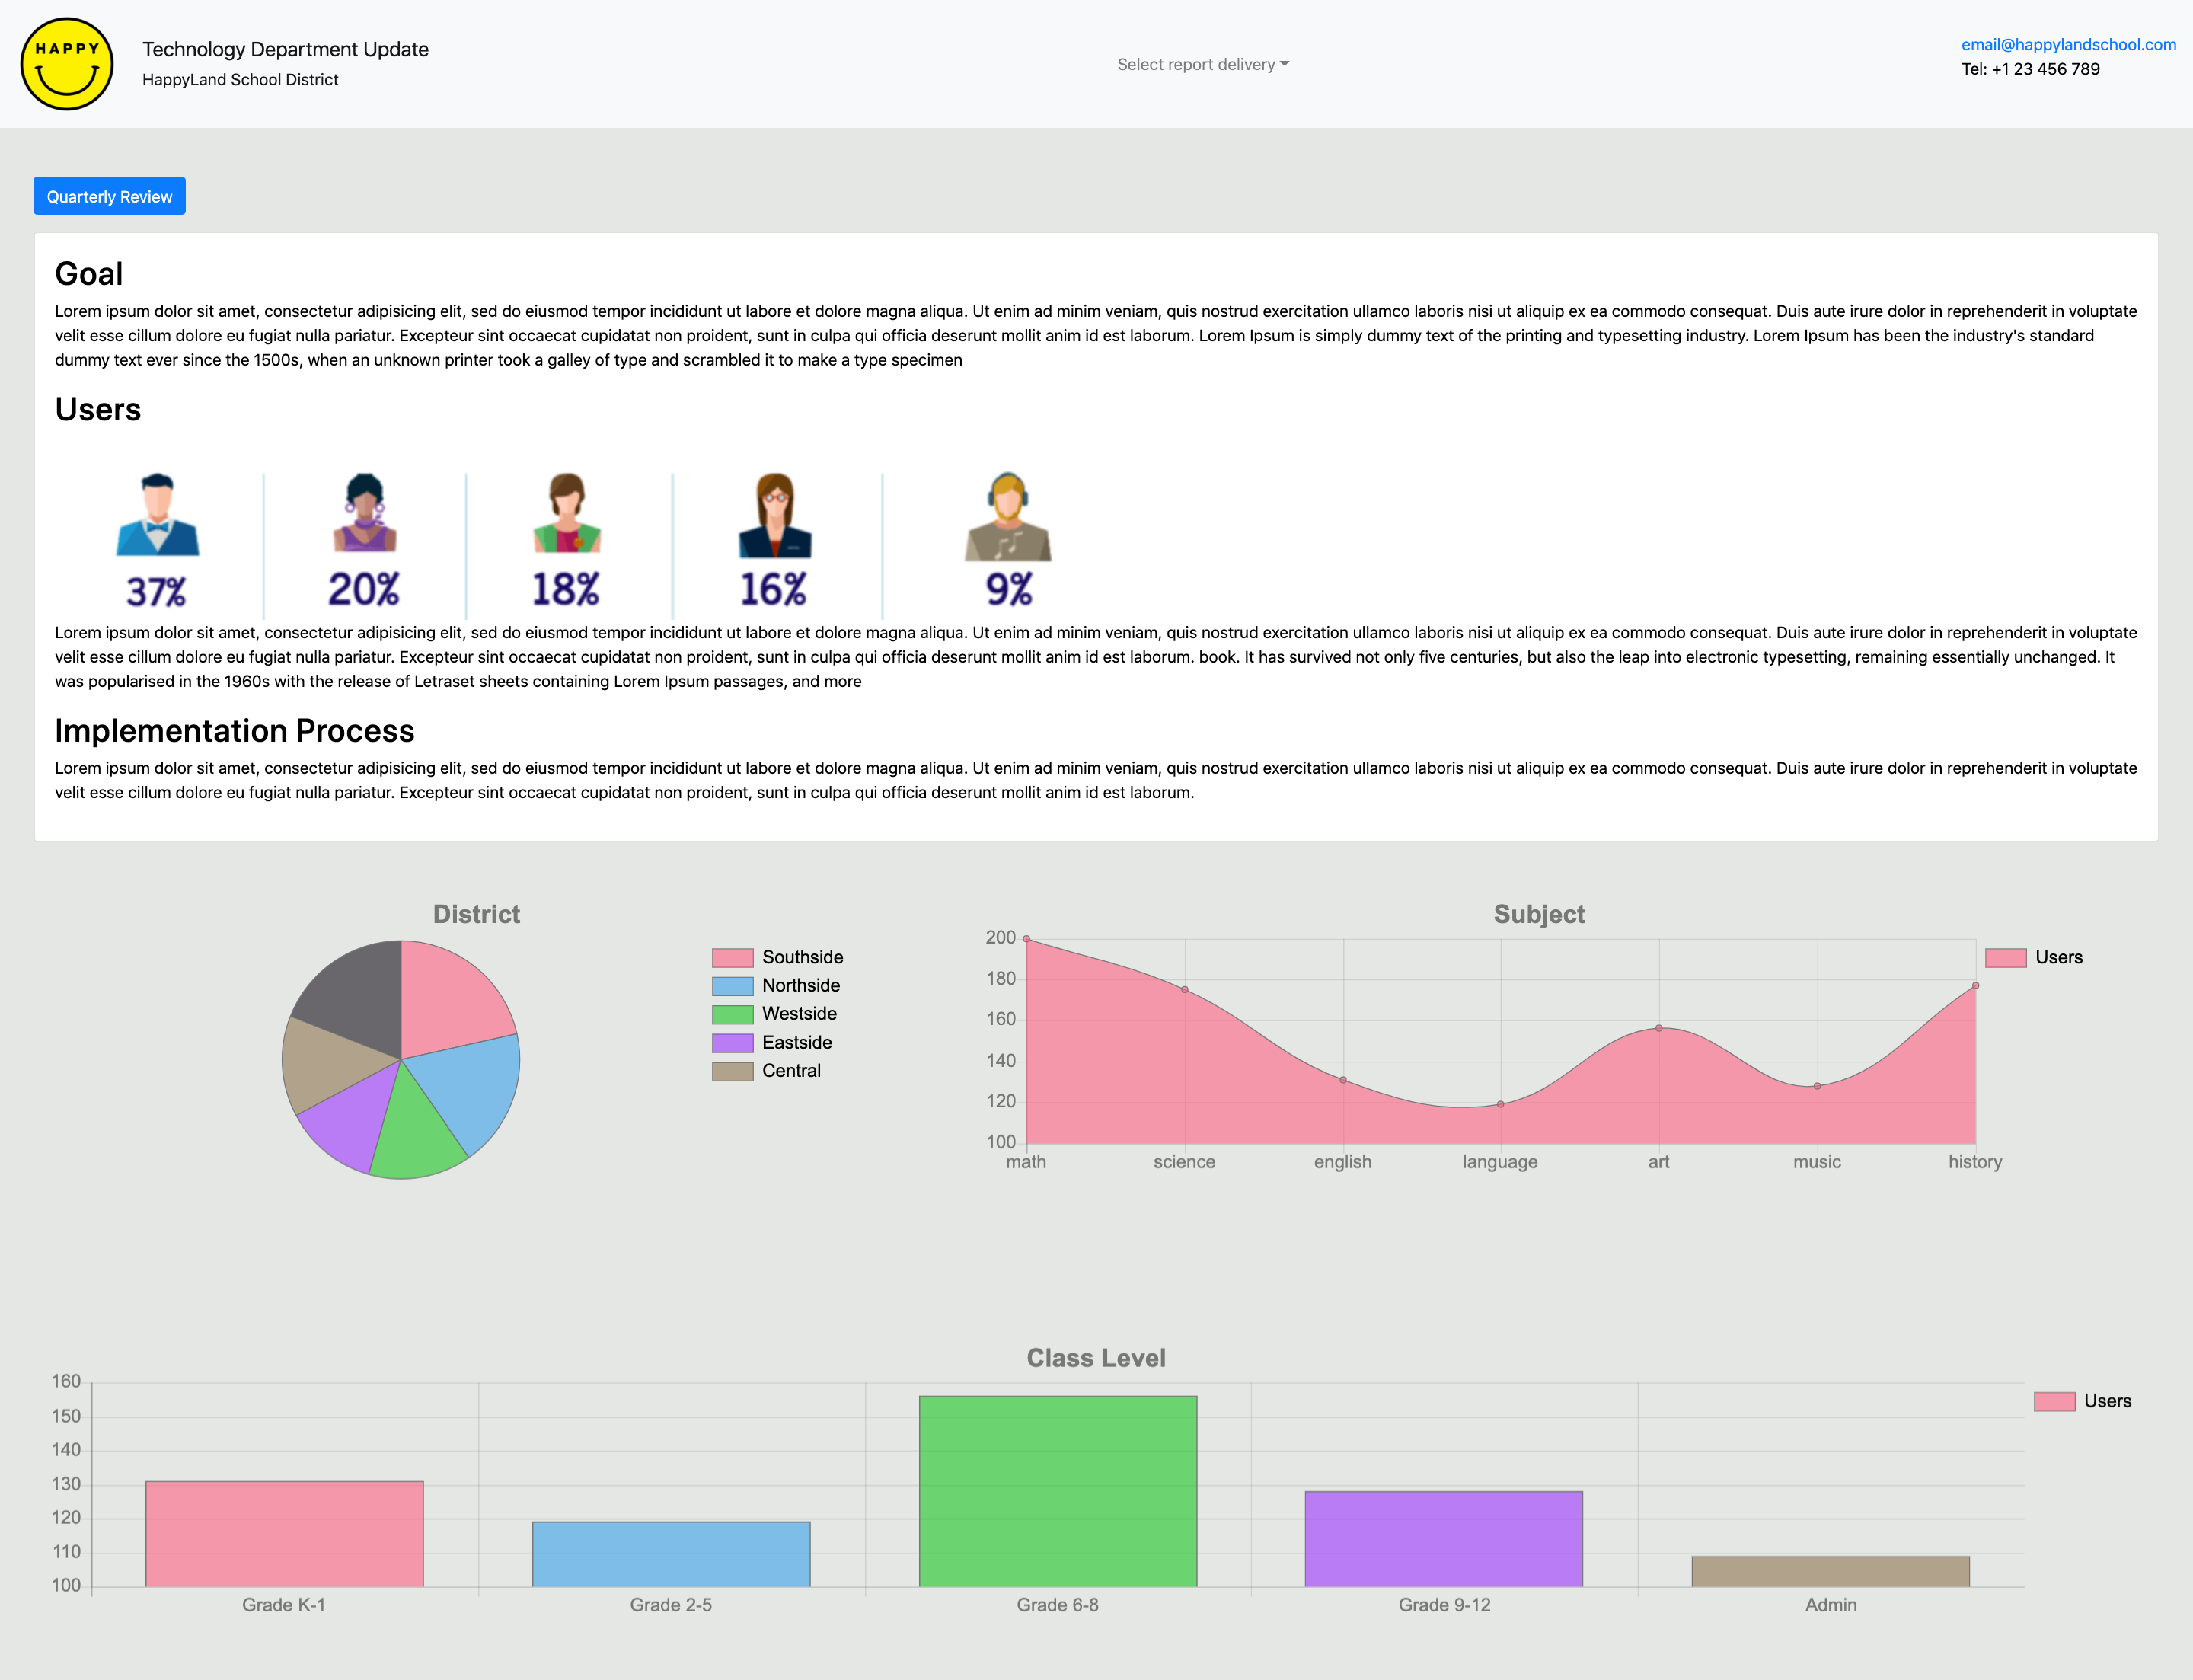
Scenario: Director of Technology released a new product to the school district. The Director needs to validate the new technology is beneficial to the district and present it to the administration. Data visualization will be updated to the school’s website for the administration meeting.
Goal: Data visualization - summarize the district’s activity on the release and usability of the tool in each school.
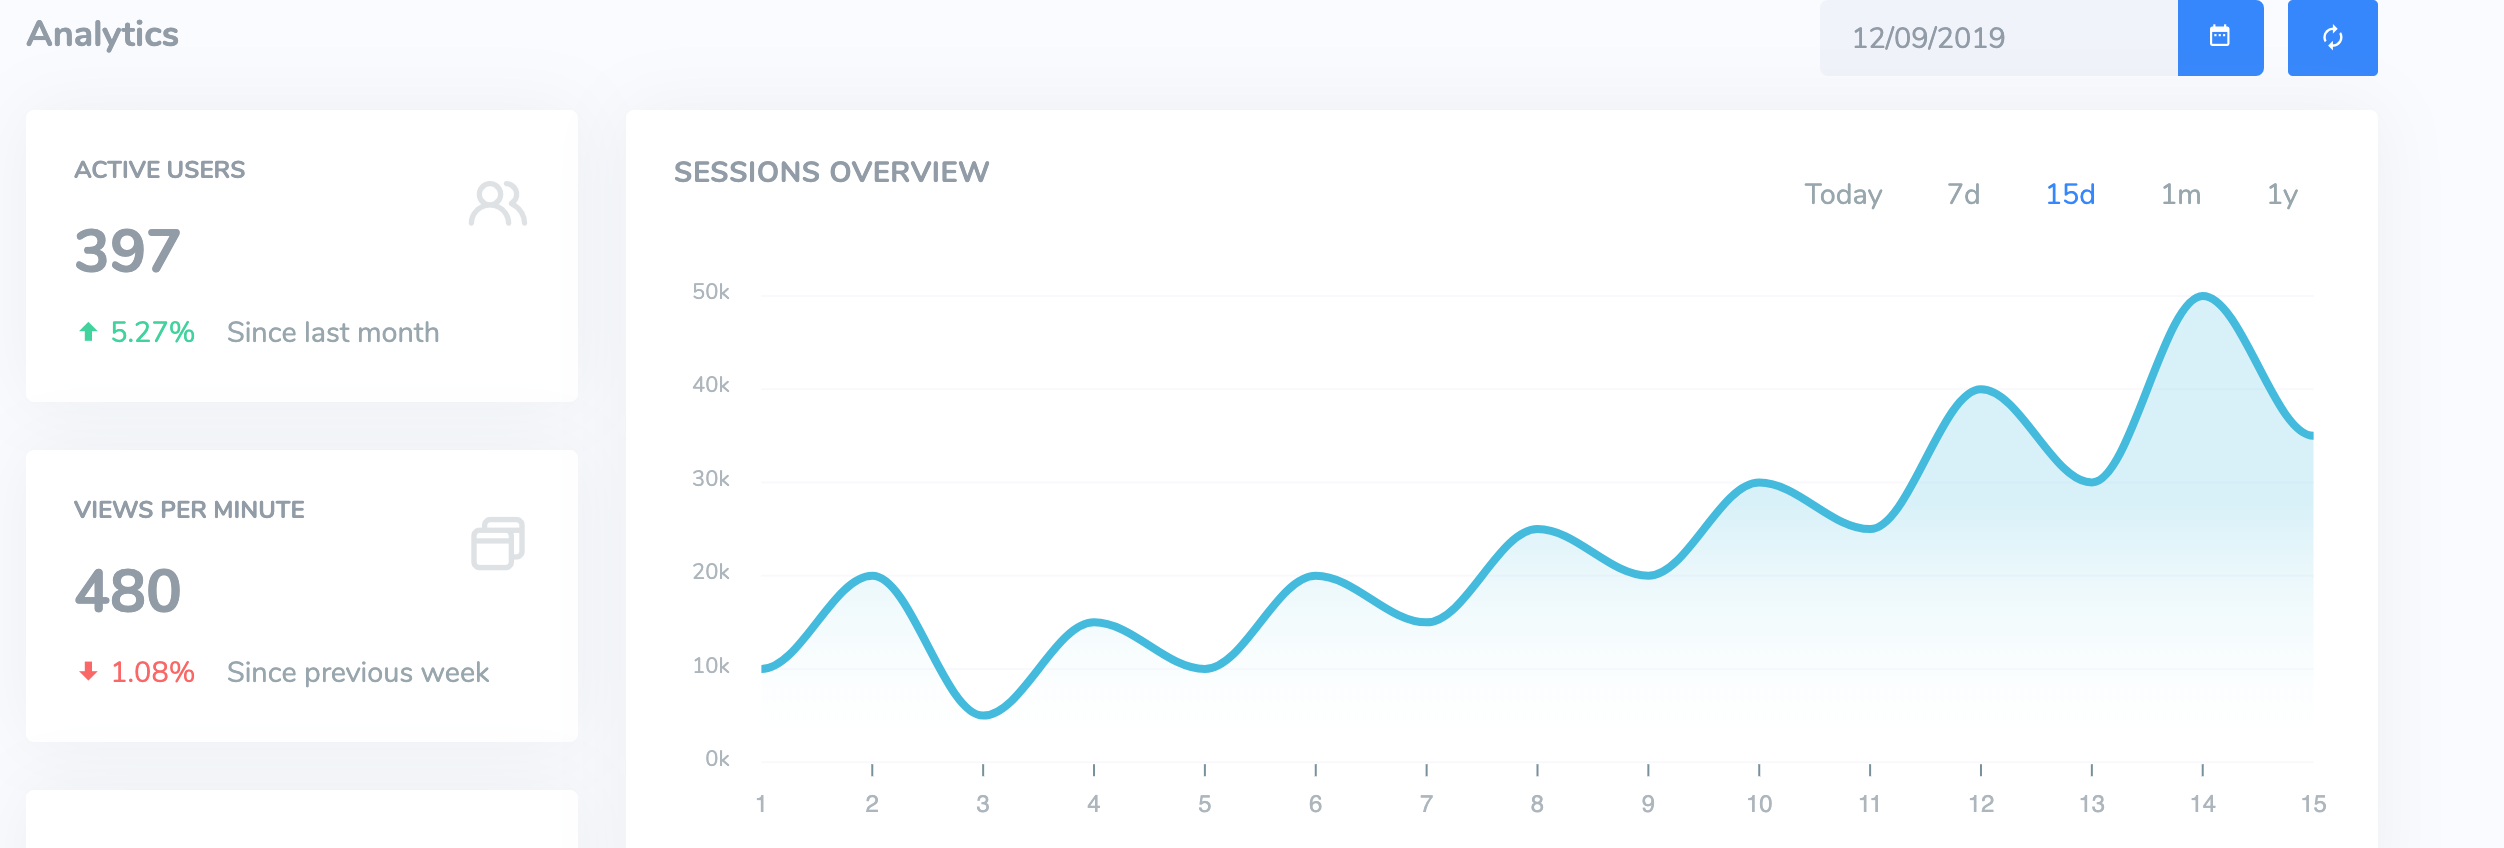
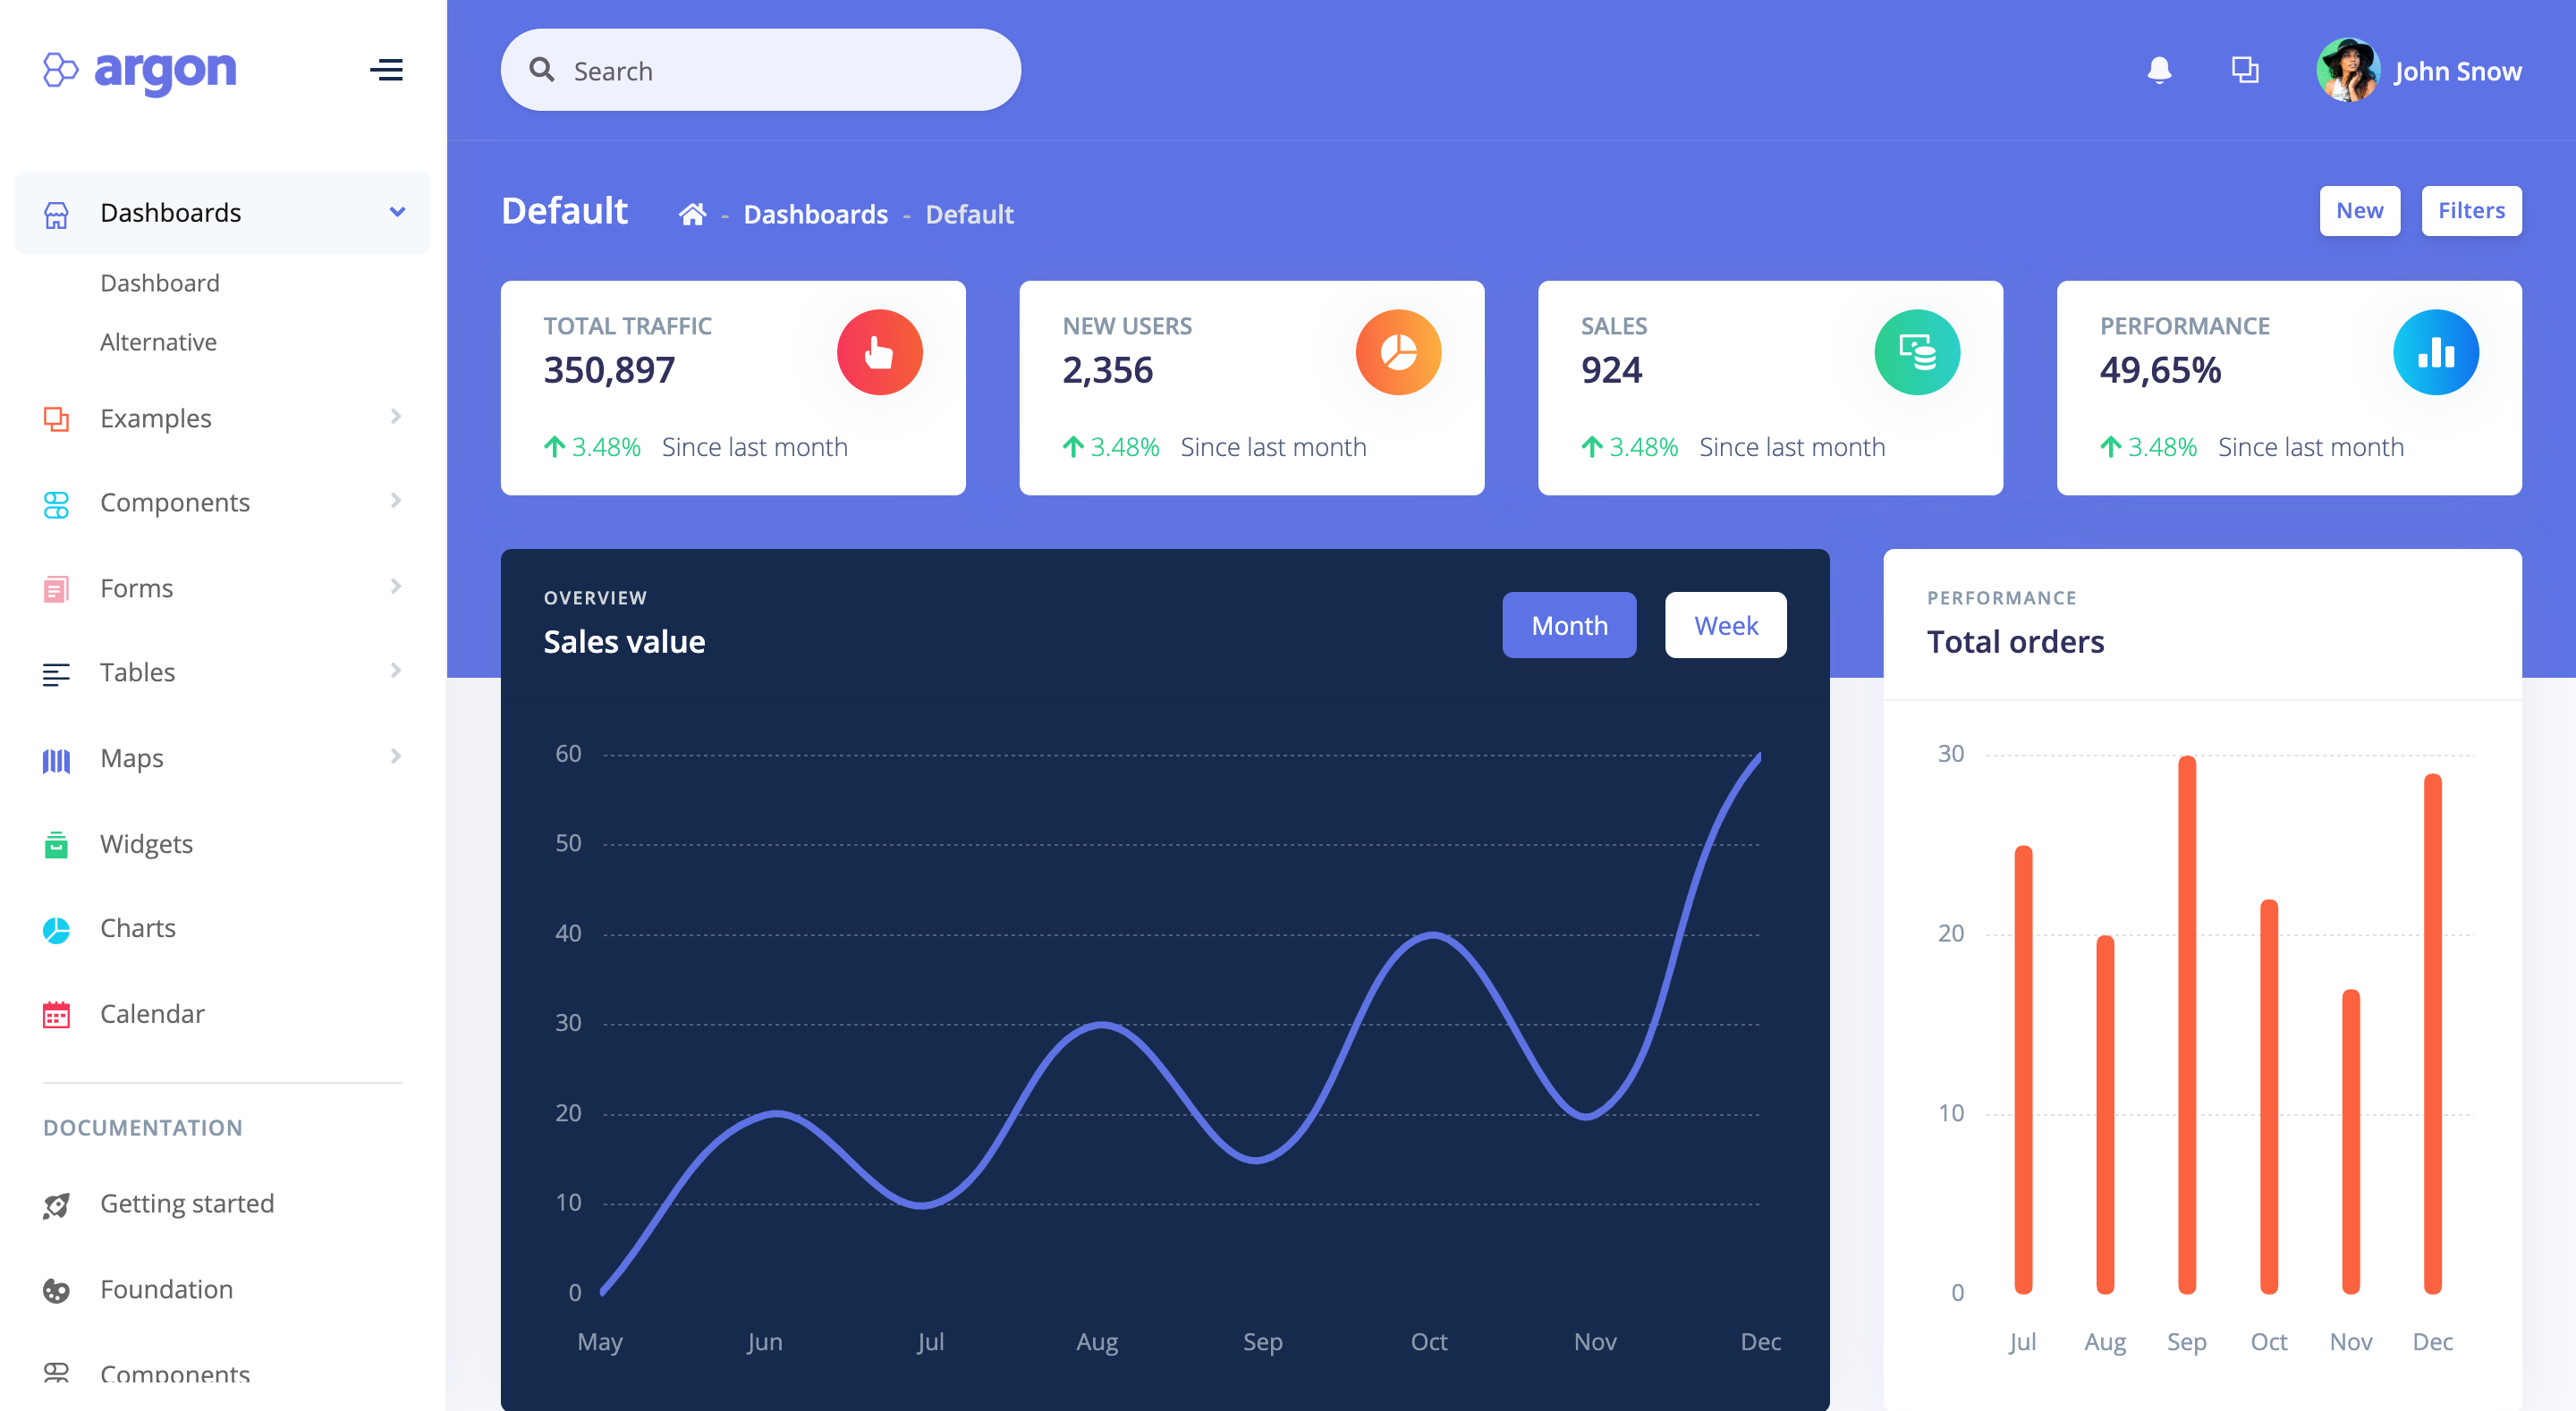
Inspiration: Dashboards
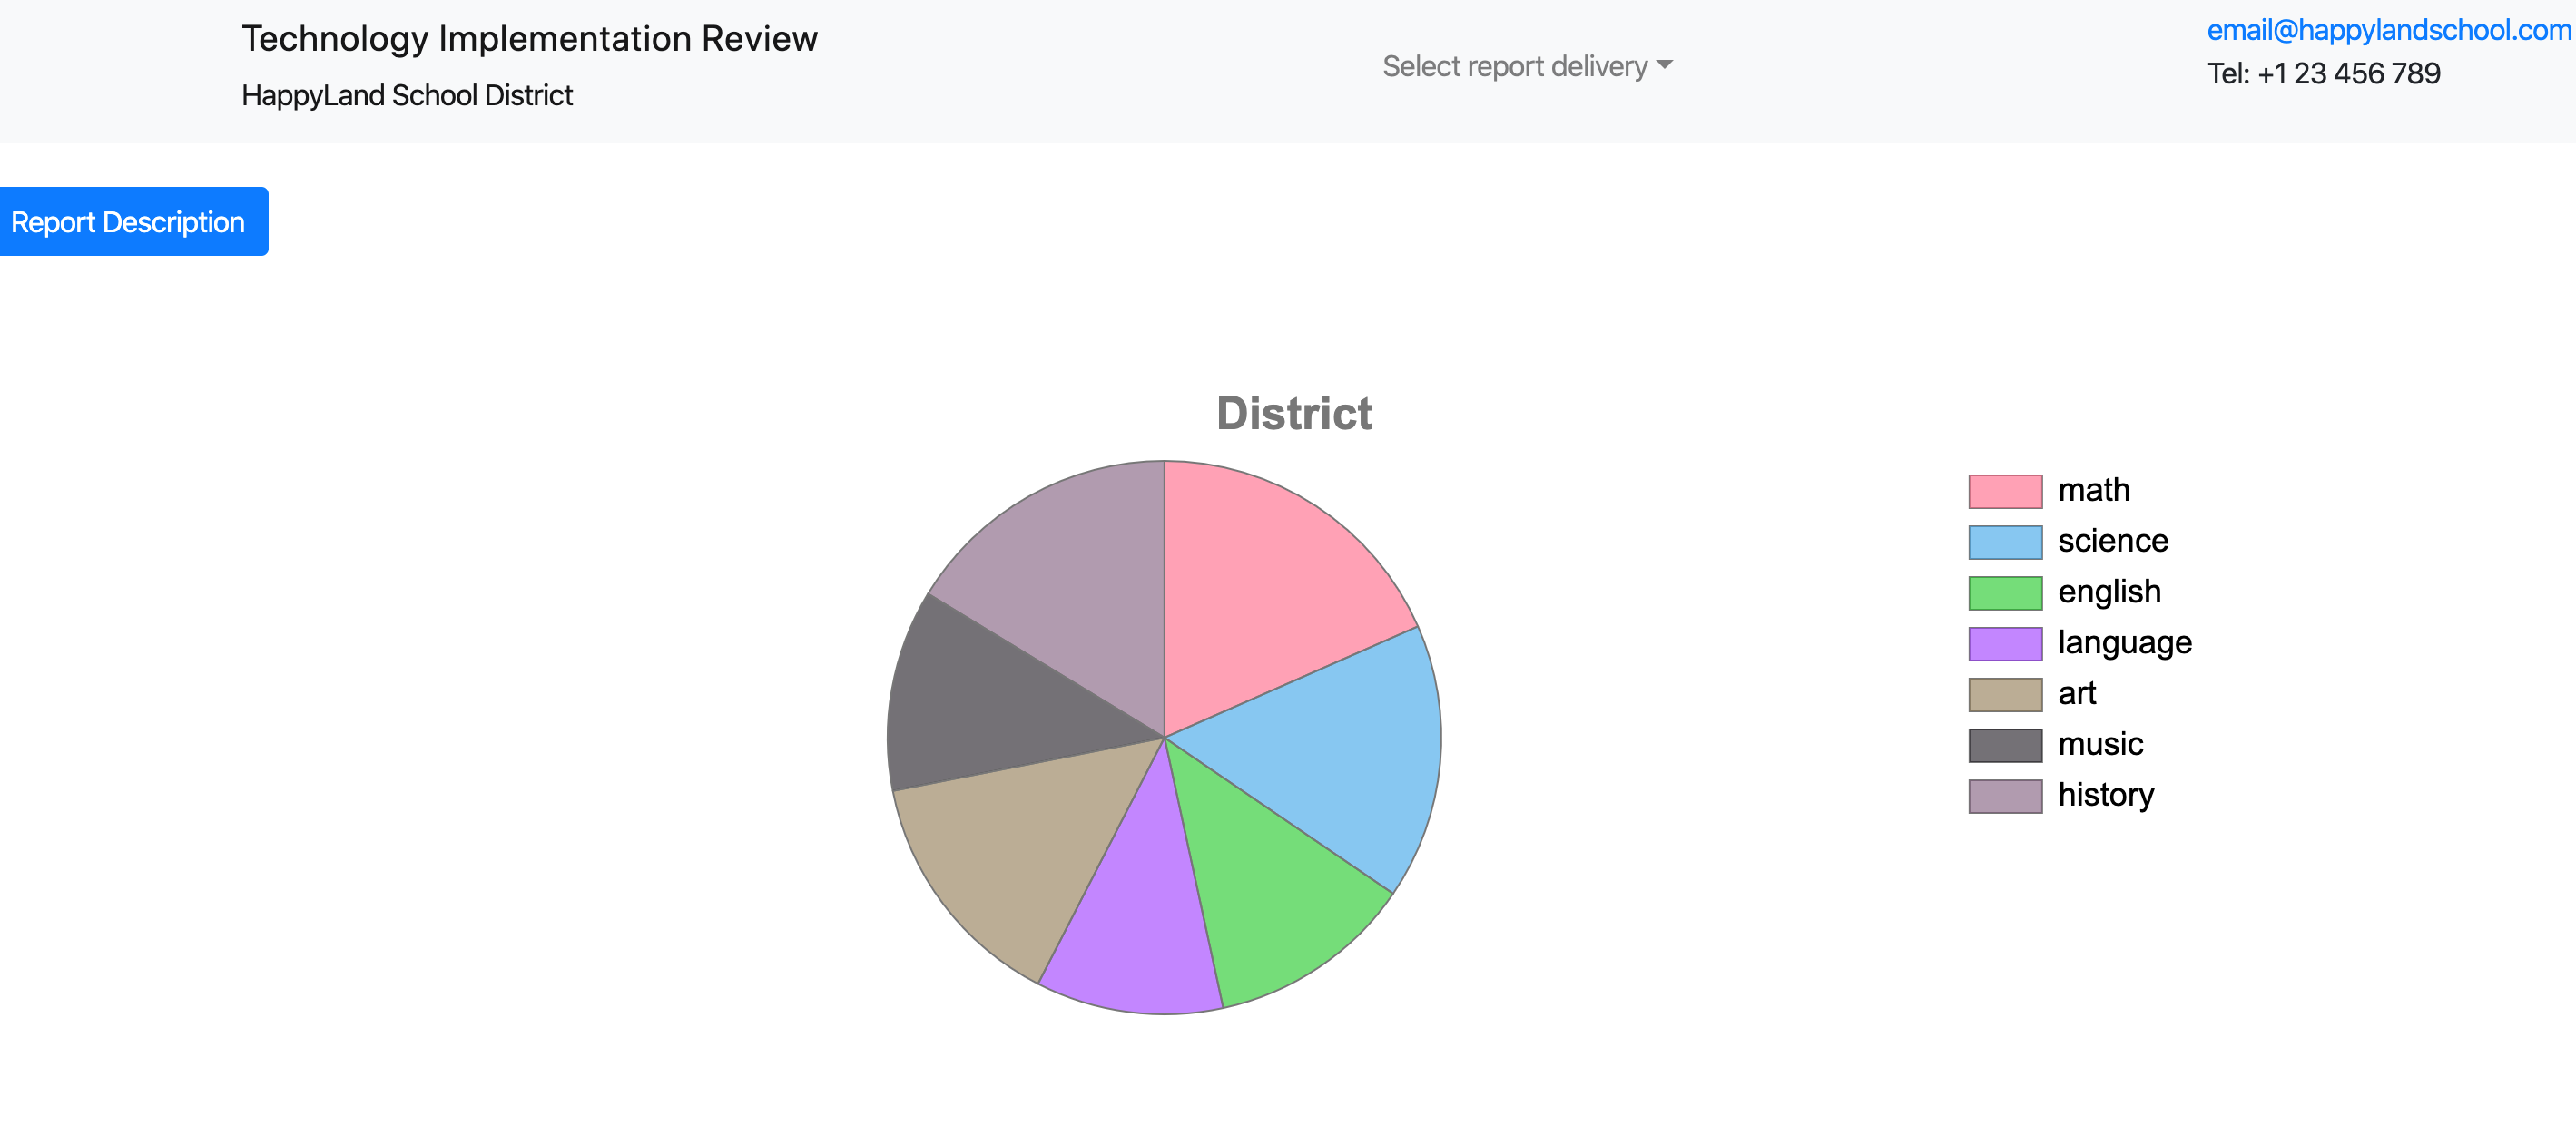
Charts - (interactive) Bar Chart (#) #of teachers that have implemented the technology/schools in the district
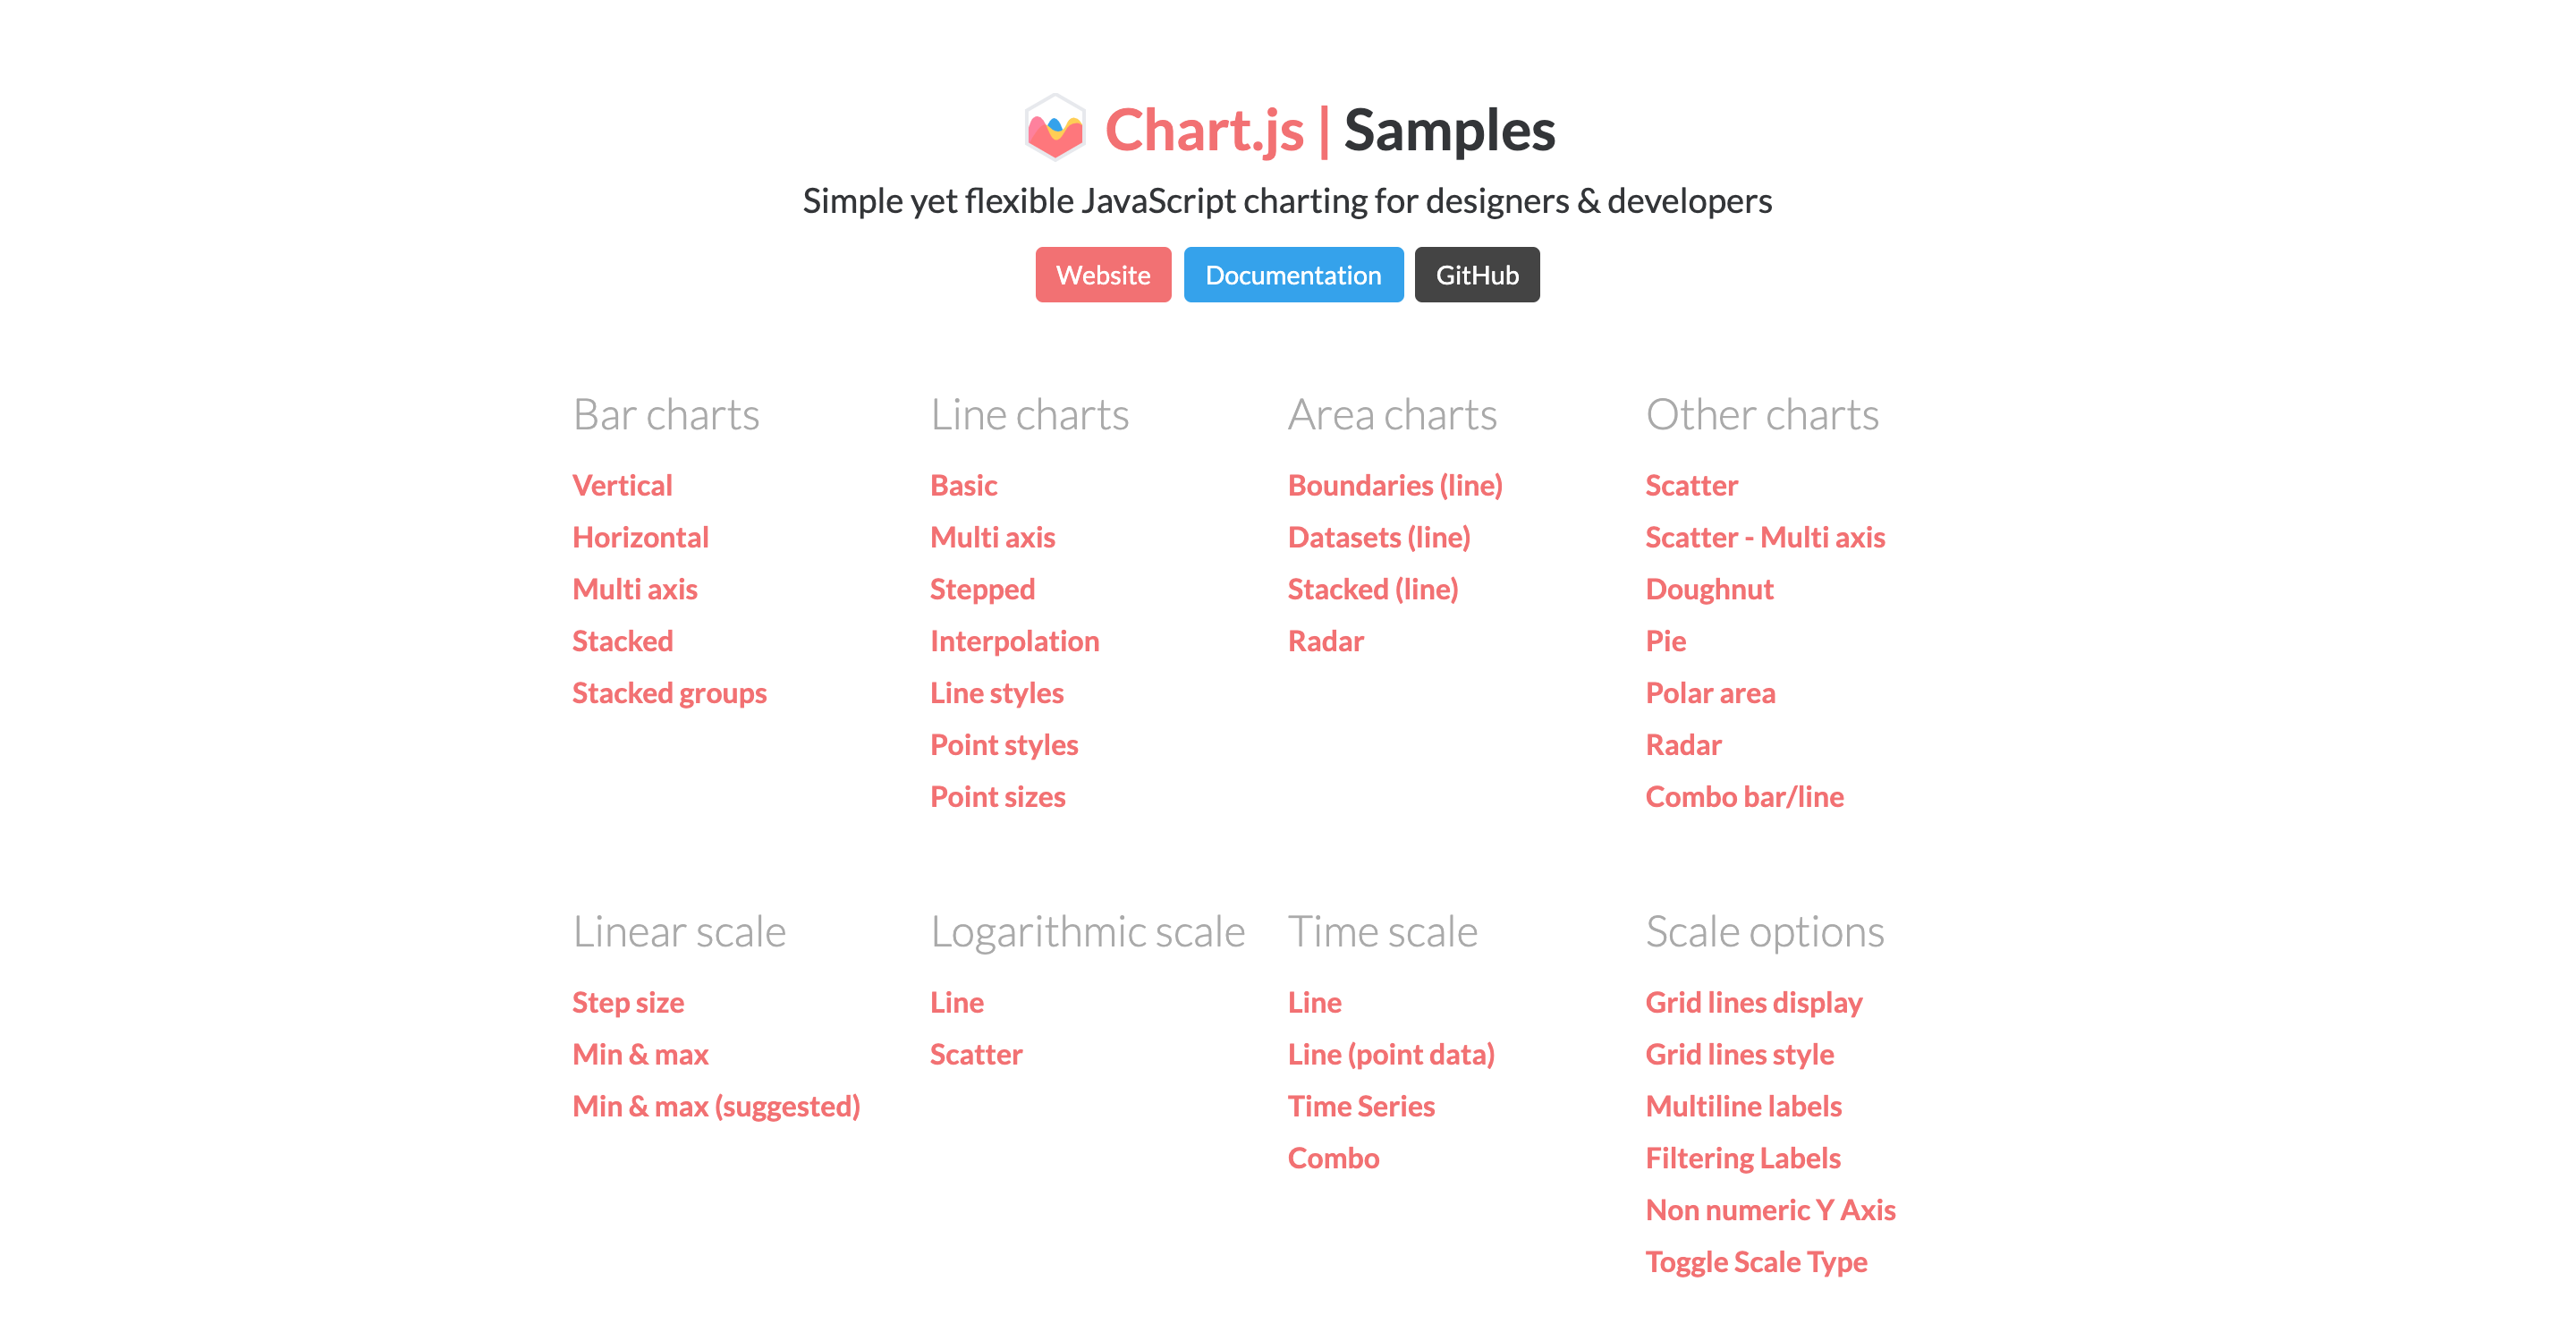
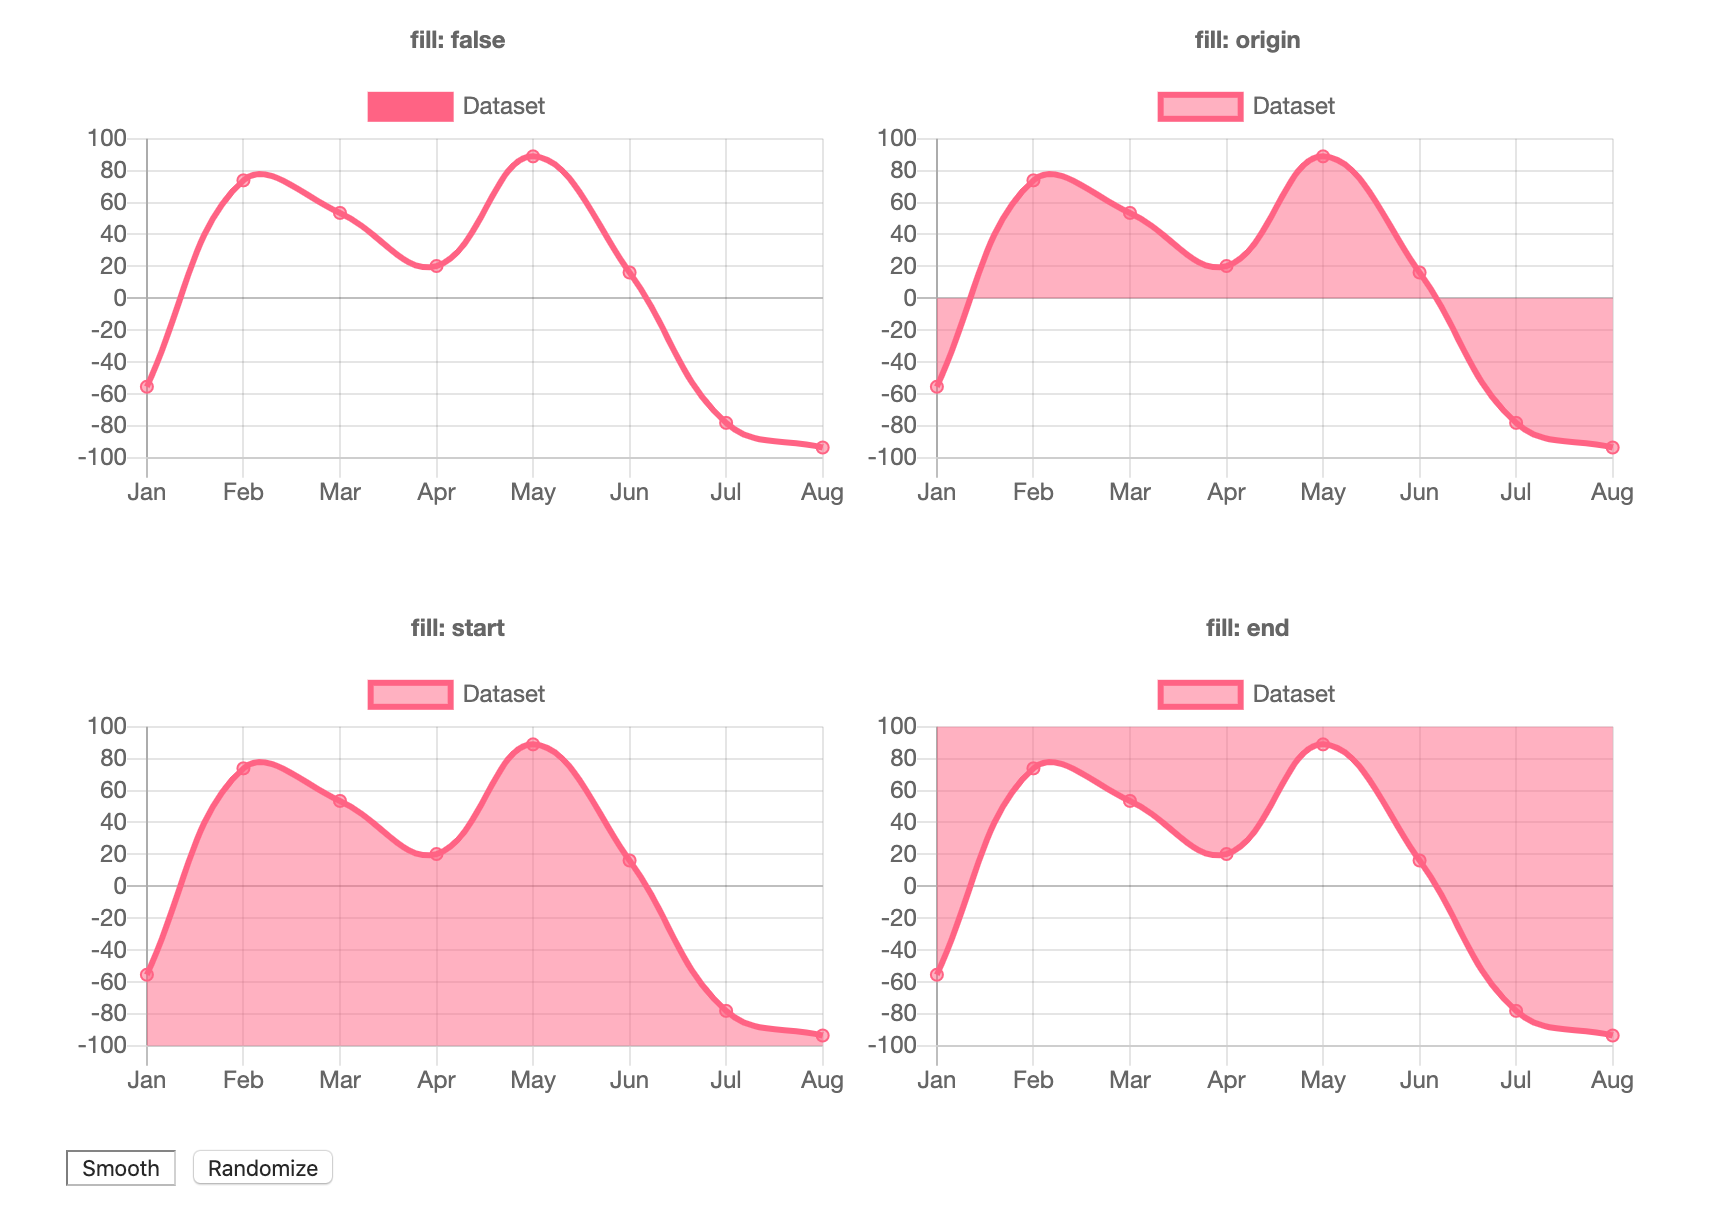
Sample Chart.js ::
https://www.chartjs.org/samples/latest/charts/area/line-boundaries.html https://www.chartjs.org/samples/latest/charts/bar/vertical.html interactive charts
For this new project I will sample data to reflect the school’s implementation of the technology. (data)
Update HTML for meeting - drop-down menu By school (view Teachers and Grades by School using the technology Total district
*possible button with drop-down to see different delivery options
Review youtube videos on chart.js
review sample code-
- https://vegibit.com/create-a-bar-chart-with-d3-javascript/
- https://codepen.io/SitePoint/pen/Kpager
- https://codepen.io/BenShelton/pen/dNmWmG
- https://github.com/generative-light/p5.scribble.js
- Outline html design (sample design)
- Title
- Headline of report
- Description
- buttons
- 3 graphs
This project was a trial and error exploration in learning html, css, bootstrap, java script, chart.js, ATOM ![]() and Github. I enjoyed each layer of unraveling the code to create this project. WHile designing this project it helped to start with my outline of what I wanted to design as a final project. The initial layout design was simple. As I learned more about each piece of the project I began to visualize other elements I wanted to include in the design. This process of learning while creating assisted in establishing a comfort level in using the code and tools for the design.
and Github. I enjoyed each layer of unraveling the code to create this project. WHile designing this project it helped to start with my outline of what I wanted to design as a final project. The initial layout design was simple. As I learned more about each piece of the project I began to visualize other elements I wanted to include in the design. This process of learning while creating assisted in establishing a comfort level in using the code and tools for the design.
This design focus was to provide a simple UI for sharing data via a html platform. The code learned in this design was researched using online tools like you-tube videos and other tutorials. I would advise others to continue searching for solutions if they are not sure of the final product design. My process was layout structure, research code and samples available online and then use the tutorials to guide me during the coding. The more I researched and reviewed sample coding the design unfolded.
Read/Watch, Learn, Practice and Code!
💬 mastering the GitHub README.md page resource: https://guides.github.com/features/mastering-markdown was very helpful in creating this document.
Thank you! Jennifer jc5221
